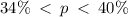
95% confidence interval for the proportion of all people in the United States who would indicate that their favorite sport to watch on television is American football is (0.34, 0.40).
Concluding that is is not reasonable to believe that 33% is the actual percent of people in the United States whose favorite sport to watch on television is American football
Given that,
A recent survey collected information on television viewing habits from a random sample of 1,000 people in the United States.
Of those sampled, 37 percent indicated that their favorite sport to watch on television was American football.
We have to determine,
Construct and interpret a 95 percent confidence interval for the proportion of all people in the United States who would indicate that their favorite sport to watch on television is American football.
According to the question,
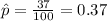
Sample proportion p = 37% = 0.37
Sample space n = 1000
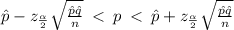
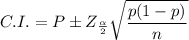
The (1 - α)% confidence interval for the population proportion,
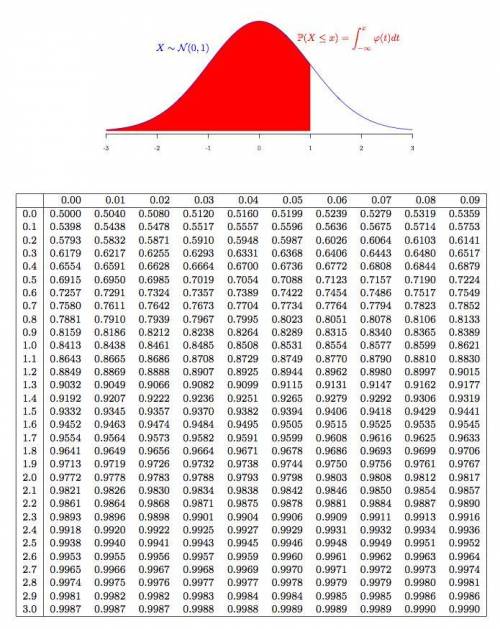
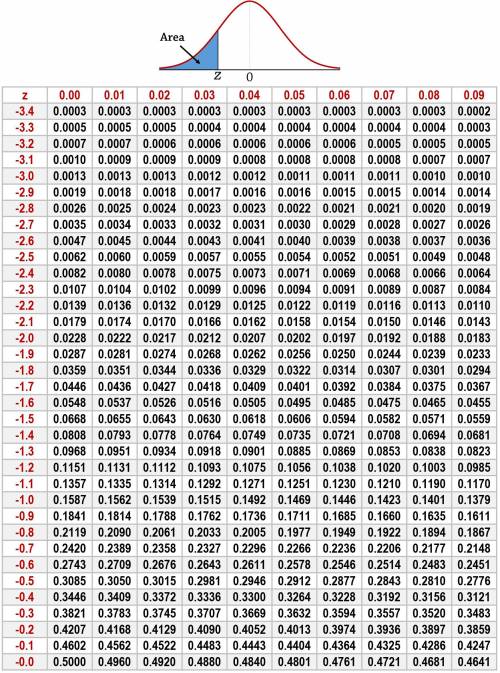
To compute the critical value of z for 95% confidence interval as follows:
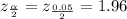
By using a z-table for the value.
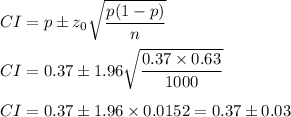
Compute the 95% confidence interval for the population proportion p as follows:
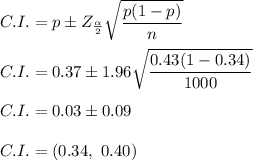
Hence, 95% confidence interval for the proportion of all people in the United States who would indicate that their favorite sport to watch on television is American football is (0.34, 0.40).
The hypothesis can be defined as:
H₀: The percentage of people in the United States whose favorite sport to watch on television is American football is 33%, i.e. p = 0.33.
Hₐ: The percentage of people in the United States whose favorite sport to watch on television is American football is different from 33%, i.e. p ≠ 0.33
The hypothesis can be tested based on a confidence interval.
The (1 - α)% confidence interval includes the null value of the test then the null hypothesis will not be rejected.
And if the (1 - α)% confidence interval includes the null value of the test then the null hypothesis will be rejected.
The 95 confidence interval for the proportion of all people in the United States who would indicate that their favorite sport to watch on television is American football is (0.34, 0.40).
The confidence interval does includes the null value of p, i.e. 0.33.
So, the null hypothesis will be rejected.
Hence, Concluding that is is not reasonable to believe that 33% is the actual percent of people in the United States whose favorite sport to watch on television is American football
To know more about Probability click the link given below.
link
 23
23 calculated as:
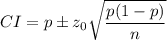
 is the z score
  .
.
 , we have: