Option C. Stem Leaves 6 7 7 2 5 8 5 7 9 9 9 0 9 10 0
Option D.
Step-by-step explanation:
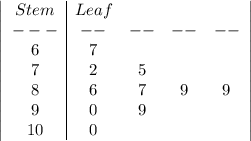
The data values are 67, 72, 85, 75, 89, 89, 87, 90, 99 and 100.
Arranging the data values in ascending order
67, 72, 75, 85, 87, 89, 89, 90, 99, 100
The stem and lead plot can be shown under and stem is denoted as "S" whereas leaves are denoted as "L".
S L
6 7
7 2 5
8 5 7 9 9
9 0 9
10 0
The longer row of stem indicates the higher frequencies and so the length of rows are similar to the heights of bars in histogram.
 2
2