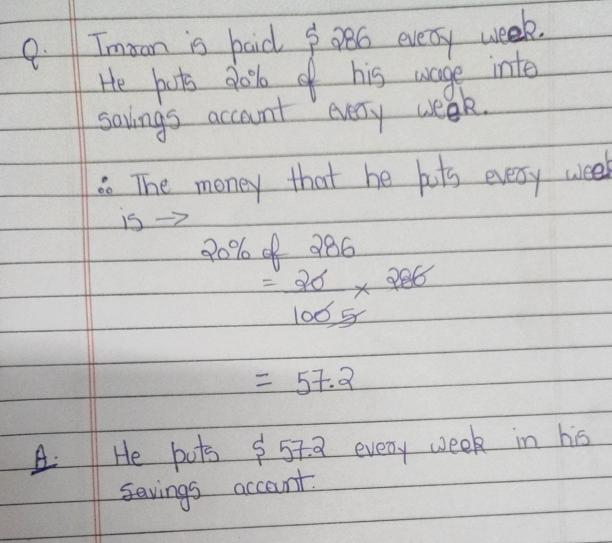
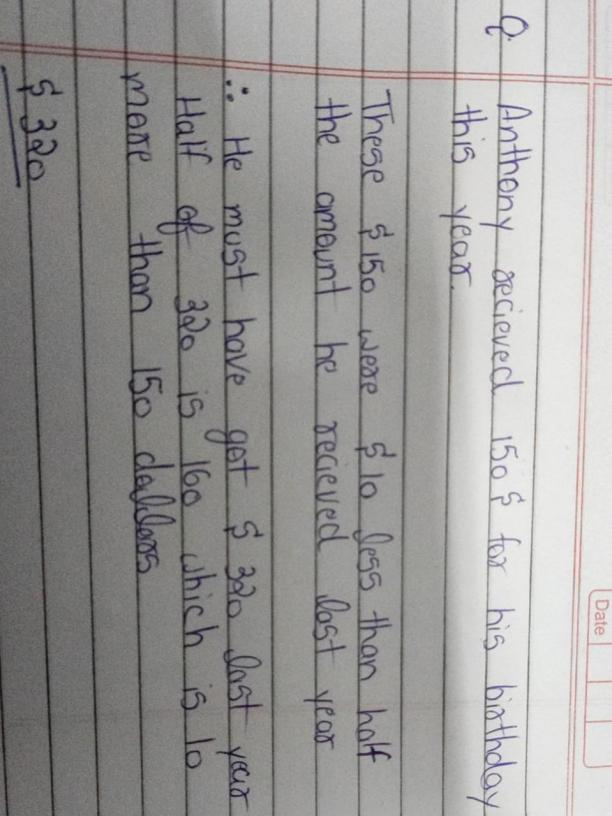
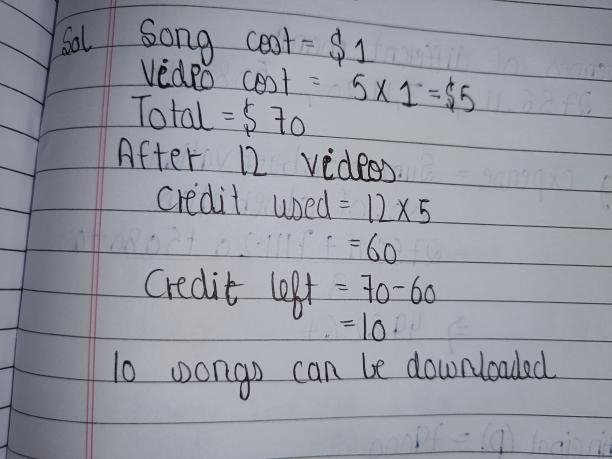
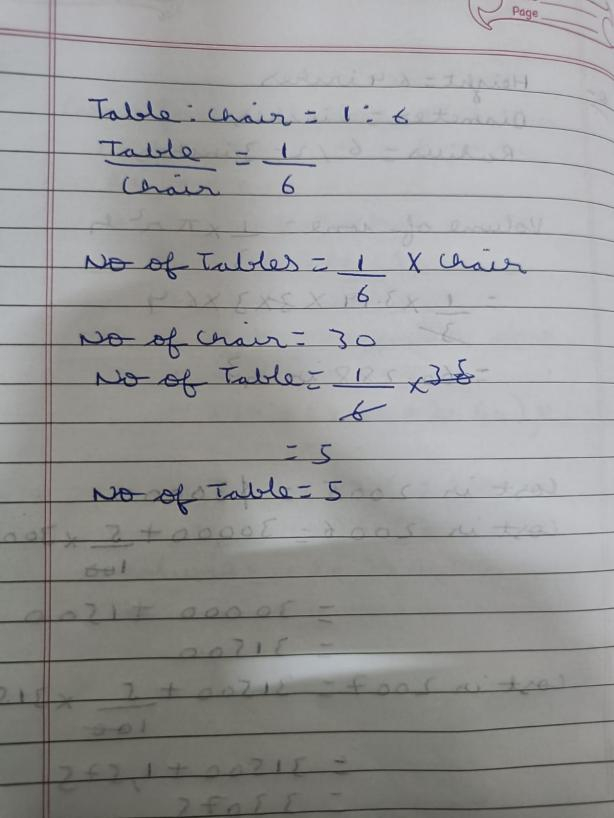
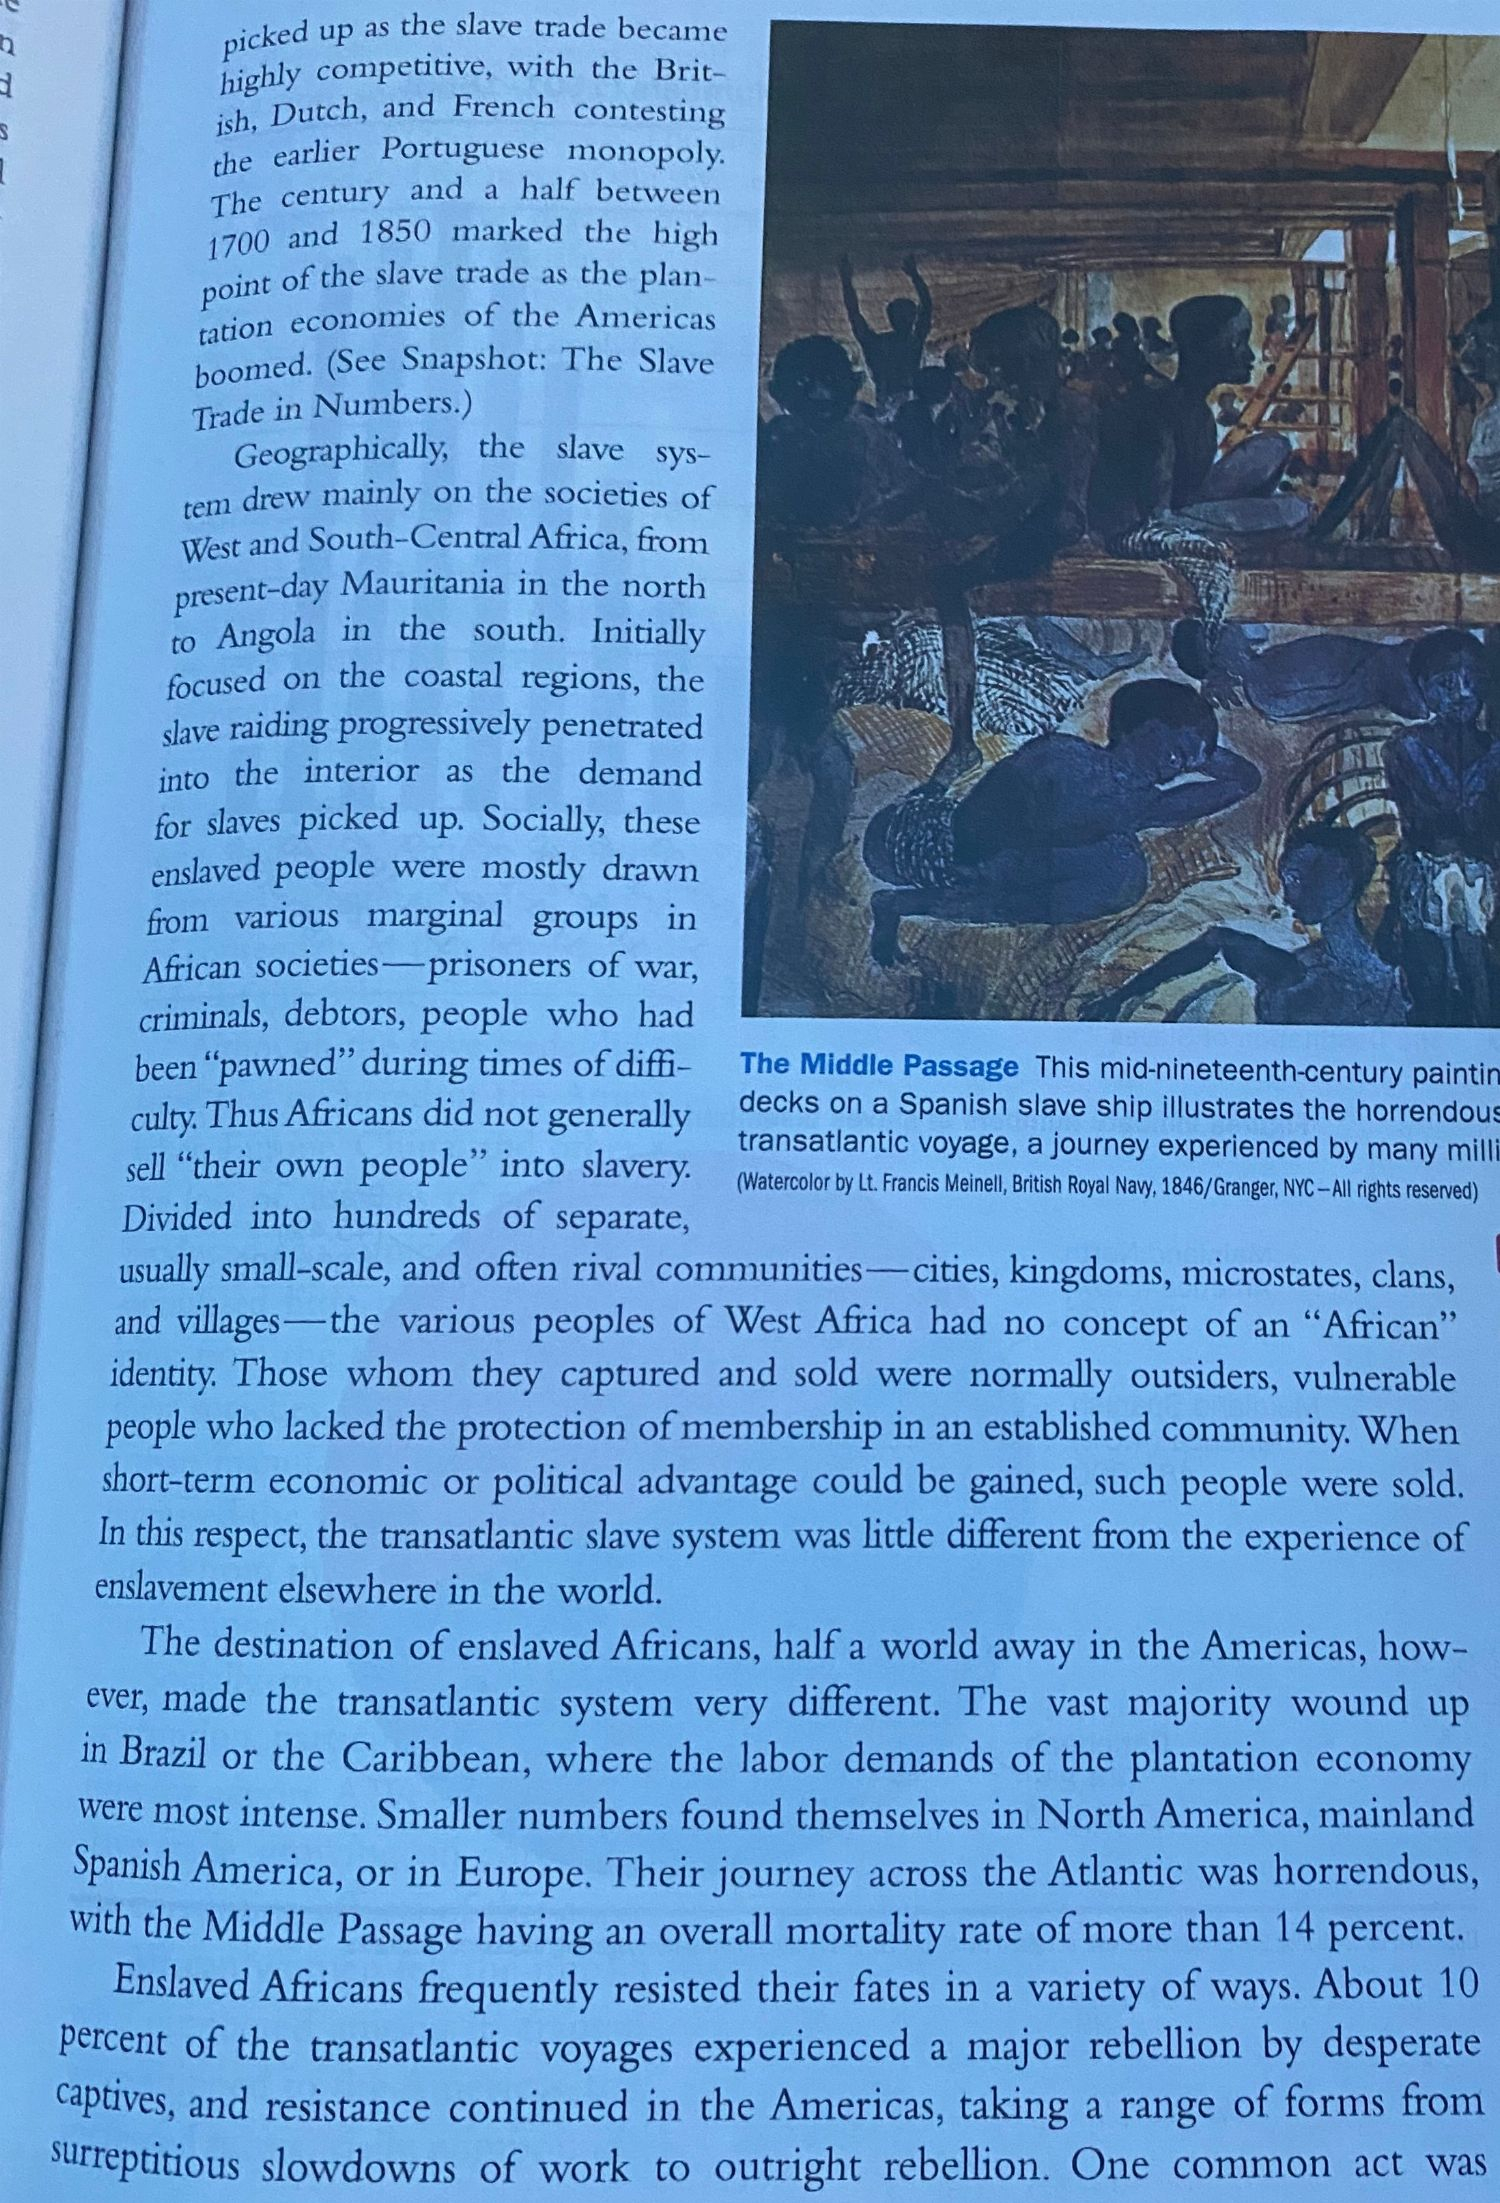
Malcolm's family left home to go on vacation. This graph shows the relationship between the distance and the amount of time they traveled during two different parts of the trip. Family Vacation
400
300
IT
Distance (Miles)
200
100
0
4
5
3
Time (Hours)
Approximately how much faster did Malcolm's family travel during the second part of the trip (U) than during the first part of the trip (U)?
A
10 miles per hour
B
20 miles per hour
С
50 miles per hour
D
60 miles per hour