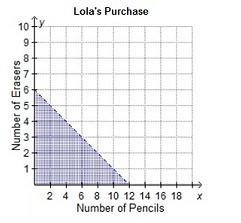
Answer: Graph C is the answer. Attached lower.
Explanation:
Lola bought X pencils that cost $0.25 and Y erasers that cost $0.50.
Total expenditure is less than $3.
If we represent expense in the equation form then it will be:
Expense on pencils + expense on erasers = Total expense which is < 3;
0.25X + 0.50Y < 3.
Now we divide the inequality by 0.25
X + 2Y < 12.
This inequality when graphed, line will be plotted in dots and area below the line will be in the shaded form.
Slope of this line is = (-1/2) {from the standard equation of line y = mx + c).
Now we come to the graphs. Here dotted line graphs are A or C.
We will calculate the slopes of the lines from the graphs A and C to get tha answer.
-For Graph A.
The end points are (12, 0) and (0, 3);
So slope = (y-y')/(x-x') = (3-0)/(0-12) = -3/12 = -1/4.
For Graph C.
End points the line are (0, 6) and (12, 0);
Slope of the line = (0-6)/(12-0) = -6/12 = -1/2.
Therefore Graph C is the answer.