Correct option is (d): Neither X nor Y can be well-approximated by a normal random variable.
Step-by-step explanation:
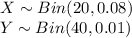
The sample size of males having color-blindness is, n (X) = 20.
The sample size of females having color-blindness is, n (Y) = 40.
The proportion of males that suffer from color-blindness is, P (X) = 0.08.
The proportion of females that suffer from color-blindness is, P (Y) = 0.01.
Now both the random variables X and Y follows a Binomial distribution,
A normal distribution is used to approximate the binomial distribution if the sample is large, i.e n ≥ 30 and the probability of success is very close to 0.50.
Also if np ≥ 10 and n (1 - p) ≥ 10, the binomial distribution can be approximated by the normal distribution.
For the sample of men (X):
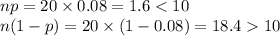
In this case neither n > 30 nor p is close to 0.50.
And np < 10.
Thus, the random variable X cannot be approximated by the normal distribution.
For the sample of men (Y):
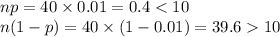
In this case n > 30 but p is not close to 0.50.
And np < 10.
Thus, the random variable Y cannot be approximated by the normal distribution.
Thus, both the random variables cannot be approximated by the normal distribution.
The correct option is (d).
 2
2 )
)
 = 3
= 3 = -3
= -3 .
.
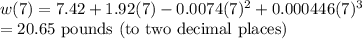
 = 20.28 ( Approximately taken upto two decimal place)