A) yes, there is a clear correlation: "The more hours the Internet browsing, the lower the score in the math test."
B) y = -2 x + 95
C) slope is: number of units of test score that go down for every browsing hour
y-intercept is: the maximum test score reported
Step-by-step explanation:
Part A)
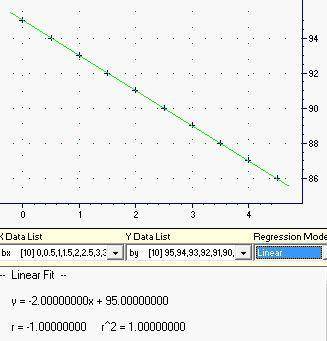
There is clearly a correlation between the number of hours of Internet browsing and the scores on a math test. The more hours the Internet browsing, the lower the score in the math test. If we plot the data in pairs (x, y) we observe a clear tendency with the shape of a line (representing the scores) going down as the number of hours of Internet browsing increases. (See attached image)
Part B)
We can run a regression analysis on these points, or simple observe that for every half hour increase of browsing time, the scores go down in one unit.
The equation for this line of best fit is given by:
y = - 2 x + 95
being "x" the number of hours of Internet browsing, and "Y" the math test scores.
the slope "-2" is the number of units of test score that go down for every browsing hour.
The y=intercept is the maximum test score (95) reported