import java.util.*;
import java.io.BufferedReader;
import java.io.IOException;
import java.io.InputStreamReader;
import java.util.Arrays;
class GFG
{
// Function for calculating mean
public static double findMean(double a[], int n)
{
int sum = 0;
for (int i = 0; i < n; i++)
sum += a[i];
return (double)sum / (double)n;
}
// Function for calculating median
public static double findMedian(double a[], int n)
{
// First we sort the array
Arrays.sort(a);
// check for even case
if (n % 2 != 0)
return (double)a[n / 2];
return (double)(a[(n - 1) / 2] + a[n / 2]) / 2.0;
}
public static double findMode(double a[], int n)
{
// The output array b[] will
// have sorted array
//int []b = new int[n];
// variable to store max of
// input array which will
// to have size of count array
double max = Arrays.stream(a).max().getAsDouble();
// auxiliary(count) array to
// store count. Initialize
// count array as 0. Size
// of count array will be
// equal to (max + 1).
double t = max + 1;
double[] count = new double[(int)t];
for (int i = 0; i < t; i++)
{
count[i] = 0;
}
// Store count of each element
// of input array
for (int i = 0; i < n; i++)
{
count[(int)(10*a[i])]++;
}
// mode is the index with maximum count
double mode = 0;
double k = count[0];
for (int i = 1; i < t; i++)
{
if (count[i] > k)
{
k = count[i];
mode = i;
}
}
return mode;
}
public static double findSmallest(double [] A, int total){
Arrays.sort(A);
return A[0];
}
public static void printAboveAvg(double arr[], int n)
{
// Find average
double avg = 0;
for (int i = 0; i < n; i++)
avg += arr[i];
avg = avg / n;
// Print elements greater than average
for (int i = 0; i < n; i++)
if (arr[i] > avg)
System.out.print(arr[i] + " ");
System.out.println();
}
public static void printrand(double [] A, int n){
Arrays.sort(A);
for(int i=0;i<n;i++){
System.out.print(A[0]+"/t");
}
System.out.println();
}
public static void printHist(double [] arr, int n) {
for (double i = 1.0; i >= 0; i-=0.1) {
System.out.print(i+" | ");
for (int j = 0; j < n; j++) {
// if array of element is greater
// then array it print x
if (arr[j] >= i)
System.out.print("x");
// else print blank spaces
else
System.out.print(" ");
}
System.out.println();
}
// print last line denoted by
for(int l = 0; l < (n + 3); l++){
System.out.print("---");
}
System.out.println();
System.out.print(" ");
for (int k = 0; k < n; k++) {
System.out.print(arr[k]+" ");
}
}
// Driver program
public static void main(String args[]) throws IOException
{
//Enter data using BufferReader
BufferedReader br = new BufferedReader(new InputStreamReader(System.in));
double [] A = new double[100];
int i=0;
System.out.println("Enter the numbers(0.0-1.0) /n Enter 9 if u have entered the numbers. /n");
do
{
A[i++]=Double.parseDouble(br.readLine());
}while(A[i-1]==9);
i--;
System.out.println("Average = " + findMean(A,i) );
System.out.println("Median = " + findMedian(A,i));
System.out.println("Element that occured most frequently = " + findMode(A,i));
System.out.println("number closest to 0.0 =" + findSmallest(A,i));
System.out.println("Numbers that are greater than the average are follows:");
printAboveAvg(A,i);
System.out.println("Numbers in random order are as follows:");
printrand(A,i);
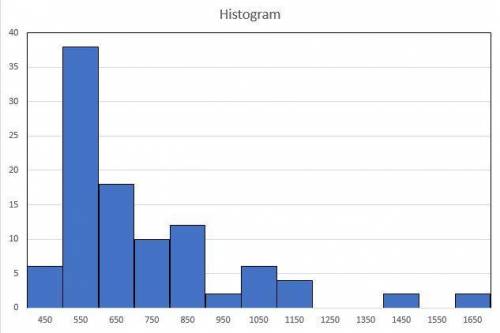
System.out.println("Histogram is bellow:");
printHist(A,i);
}
}
Explanation:
 2
2