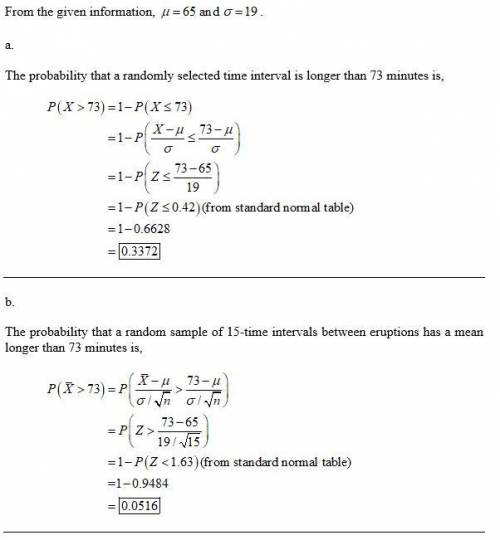
(a) The probability that a randomly selected Time interval between irruption is longer than 84 minutes is 0.3264.
(b) The probability that a random sample of 13 time intervals between irruption has a mean longer than 84 minutes is 0.0526.
(c) The probability that a random sample of 20 time intervals between irruption has a mean longer than 84 minutes is 0.0222.
(d) The probability decreases because the variability in the sample mean decreases as we increase the sample size
(e) The population mean may be larger than 75 minutes between irruption.
Step-by-step explanation:
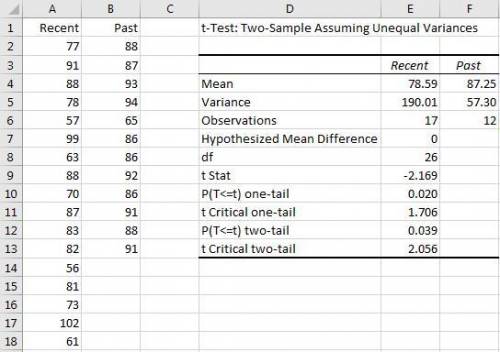
We are given that a geyser has a mean time between irruption of 75 minutes. Also, the interval of time between the eruption is normally distributed with a standard deviation of 20 minutes.
(a) Let X = the interval of time between the eruption
So, X ~ Normal(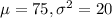 )
)
The z-score probability distribution for the normal distribution is given by;
Z =  ~ N(0,1)
where,  = population mean time between irruption = 75 minutes
 = standard deviation = 20 minutes
Now, the probability that a randomly selected Time interval between irruption is longer than 84 minutes is given by = P(X > 84 min)
P(X > 84 min) = P( >  ) = P(Z > 0.45) = 1 - P(Z
  0.45)
0.45)
= 1 - 0.6736 = 0.3264
The above probability is calculated by looking at the value of x = 0.45 in the z table which has an area of 0.6736.
(b) Let  = sample time intervals between the eruption
The z-score probability distribution for the sample mean is given by;
Z =  ~ N(0,1)
where, = population mean time between irruption = 75 minutes
= standard deviation = 20 minutes
n = sample of time intervals = 13
Now, the probability that a random sample of 13 time intervals between irruption has a mean longer than 84 minutes is given by = P( > 84 min)
P( > 84 min) = P( >  ) = P(Z > 1.62) = 1 - P(Z 1.62)
= 1 - 0.9474 = 0.0526
The above probability is calculated by looking at the value of x = 1.62 in the z table which has an area of 0.9474.
(c) Let = sample time intervals between the eruption
The z-score probability distribution for the sample mean is given by;
Z = ~ N(0,1)
where, = population mean time between irruption = 75 minutes
= standard deviation = 20 minutes
n = sample of time intervals = 20
Now, the probability that a random sample of 20 time intervals between irruption has a mean longer than 84 minutes is given by = P( > 84 min)
P( > 84 min) = P( >  ) = P(Z > 2.01) = 1 - P(Z 2.01)
= 1 - 0.9778 = 0.0222
The above probability is calculated by looking at the value of x = 2.01 in the z table which has an area of 0.9778.
(d) When increasing the sample size, the probability decreases because the variability in the sample mean decreases as we increase the sample size which we can clearly see in part (b) and (c) of the question.
(e) Since it is clear that the probability that a random sample of 20 time intervals between irruption has a mean longer than 84 minutes is very slow(less than 5%0 which means that this is an unusual event. So, we can conclude that the population mean may be larger than 75 minutes between irruption.
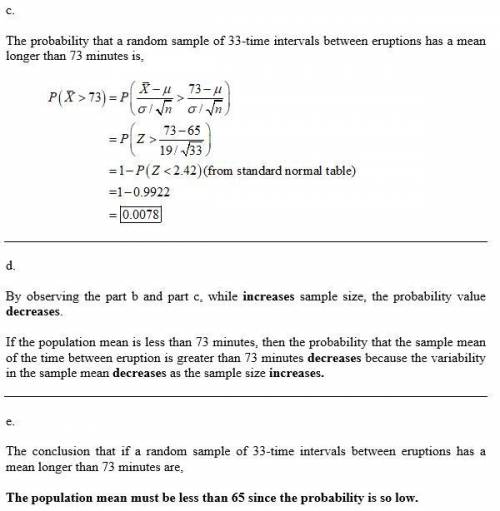
 The probability that a random sample of 13 time intervals between eruptions has a mean longer than 82 minutes =
  The probability that a random sample of 34 time intervals between eruptions has a mean longer than 82 minutes =
 = 23
= 23![P (x 82) = P[\frac{x-u}{\rho} \frac{82-72}{23}]\\\\P (x 82) = P[z 0.43]\\\\P (x 82) = 0.3336](/tpl/images/0715/1926/da3cc.png)
![P (x 82) = P[\frac{x-u}{\frac{\rho}{\sqrtn}} \frac{82-72}{\frac{23}{\sqrt{13}}}]\\\\P (x 82) = P[z 1.5676]\\\\P (x 82) = 0.0594](/tpl/images/0715/1926/1bc99.png)
![P (x 82) = P[\frac{x-u}{\frac{\rho}{\sqrtn}} \frac{82-72}{\frac{23}{\sqrt{34}}}]\\\\P (x 82) = P[z 2.5351]\\\\P (x 82) = 0.0057\\\\](/tpl/images/0715/1926/59de0.png)
 1
1