Step-by-step explanation:
Given: See the attached image
To find: the function represented by the table
Solution:
A function is a relation in which every element of the domain has a unique image in the co-domain.
Here, are elements in the domain and are elements in the co-domain.
Therefore, the table represents the function
Answer is D. 1
Step-by-step explanation:
The answer is D on Edge. (VERIFIED Edge Answer)
Make sure to click "thanks" and rate this answer to let others know this is the correct answer for this question.
Edge Tip: Answers do not mix or change.
Answer is D. 1
Step-by-step explanation:
The answer is D on Edge. (VERIFIED Edge Answer)
Make sure to click "thanks" and rate this answer to let others know this is the correct answer for this question.
Edge Tip: Answers do not mix or change.
d f(x) = 0.8(2x)
Step-by-step explanation:
if edg
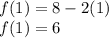
f(x) ≥ 0 over the interval [5, ∞). is a valid prediction.
Step-by-step explanation:
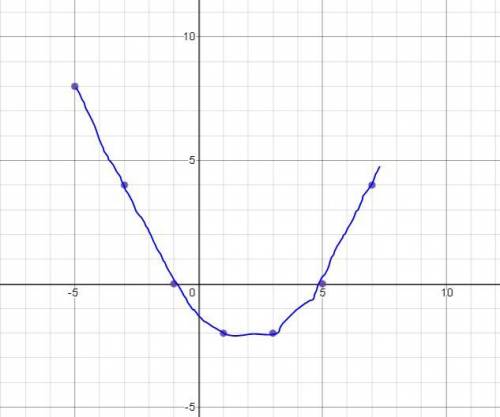
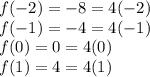
We graph the points in the table and analyze the graph that results.
The graph is attached.
With the graph in hand, let us evaluate each of the choices given.
f(x) ≥ 0 over the interval [5, ∞).
The function is positive for x ≥ 0; therefore this looks like a valid prediction.
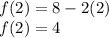
f(x) ≤ 0 over the interval [–1, ∞).
f(x) ≤ 0 only over the interval [-1,5}; therefore this choice not a valid prediction.
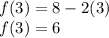
f(x) > 0 over the interval (–∞, 1).
f(x) > 0 over the interval (5, ∞]: this choice is not a valid prediction.
f(x) < 0 over the interval (–∞. –1).
f(x) < 0 over the interval [-1, 5]: this choice is also not a valid prediction.
Thus only 1st choice is correct: f(x) ≥ 0 over the interval [5, ∞).
Option B.
Step-by-step explanation:
The given table of values is
x f(x)
-3 -2
-2 0
-1 2
0 2
1 0
2 -8
3 -10
4 -20
We need to find the interval for which the function f(x) is positive.
From the given table it is clear that the value of function f(x) is negative before -2 and after 1.
The function positive between x=-2 and x=1. So, we can conclude that the function f(x) is positive for the interval (-2,1).
Therefore, he correct option is B.
Step-by-step explanation:
So I'm going to make the table here.
x f(x)
-3 -2
-2 0
-1 2
0 2
1 0
2 -8
3 -10
4 -20
Without looking at the answers we are going to deduce what intervals could make f(x) positive. Well, where is it shown as positive for the numbers given? well f(-1) and f(0) are positive, both at 2. then both f(-2) and f(1) are 0, then everything below -2 and above 1 make f(x) negative, so it looks like everything up until -2 is negative, but increasing then at -2 it turns to 0 and keeps increasing at least until some time after f(-1). It might even just stay at 2 until it gets to f(0), and then after that it decreases. Hopefully that makes sense.
Given the description, and if you on't understand I can try to explain more carefully, where does it look like it's positive? Well, it goes from negative to 0 at -2, then after that it's positive until 1, where it turns to 0 again, before decreasing. so everything between -2 and 1 look to make f(x) positive. Since f(-2) and f(1) don't themselves though it means they are not included, so you use parenthesis.
so the answer is (-2,1) Again, let me know if you need more of an explanation.
(-2,0)
Step-by-step explanation:
x row -6, -4, -2, 0, 2, 4, 6
f row -2, -1, 0, 0, 2, 4, 8
It goes from least to greatest.
Third table represents the second piece of the function f(x)
Step-by-step explanation:
The second piece of the function f(x) is
Now, we substitute some values of x and find the corresponding function values and check which table satisfy the points.
For x = 1
For x = 2
For x = 3
Among the given tables, third tables contains these values.
Third table represents the second piece of the function f(x)
It will provide an instant answer!