1) Percentages of scores less than 100: 50%
2) Percentage of scores less than 140: 97.5%
3) Percentage of scores less than 80: 16%
4) Percentage of scores between 80 and 120: 68%
5) Percentage of scores between 80 and 140: 81.5%
1) Percentage of rates less than 70 : 50%
2) Percentage of rates less than 55 : 16%
3) Percentage of rates less than 85 : 97.5%
4) Percentage of rates greater than 85 : 2.5%
5) Percentage of rates greater than 55 : 84%
6) Percentage of rates between 55 and 100: 81.5%
7) Percentage of rates between 70 and 100: 47.5%
Step-by-step explanation:
We have a random variable normally distributed with a mean of 100 and a standard deviation of 20.
1) Percentages of scores less than 100: 50%
As the mean is 100, 50% of the data lies below 100.
2) Percentage of scores less than 140: 97.5%
The data is what lies below (mean +2 sd). In this case, applies the 95% rule for the higher scores (above 100), which means we have 95/2=47.5 of the data between 100 and 140.
The data below 100 represents 50%.
So the scores under 140 are 50+47.5=97.5%.
3) Percentage of scores less than 80: 16%
The scores under 80 are a (mean-1 sd).
This means that is half of the data, less 68/2=34 (the area that is under the first standard deviation of the mean and the mean).
Then, the scores under 80 are 50-34=16%.
4) Percentage of scores between 80 and 120: 68%
The scores are under one deviation of the mean (to both sides). The 68% rule applies.
5) Percentage of scores between 80 and 140: 81.5%
The lower scores, between 80 and 100 are in the area between one deviation and the mean, so it has a percentage of 68/2=34%.
The higher scores are 2 deviations frome the mean, so they have 95/2=47.5% of the scores.
Between 80 and 140 are 34+47.5=81.5% of the scores.
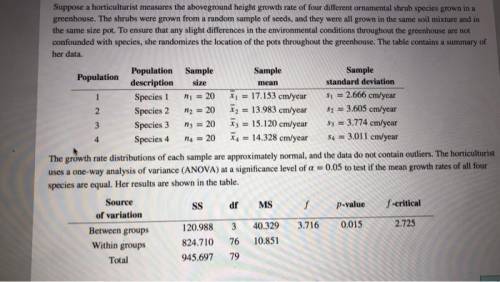
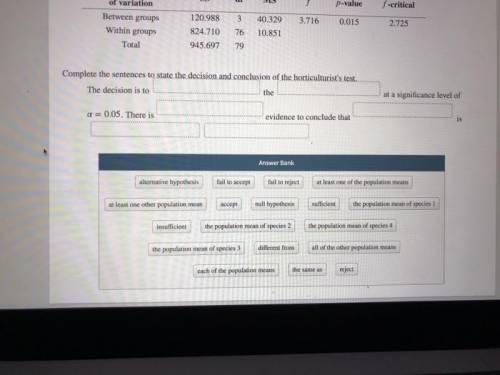
 There is sufficient evidence to conclude that at least one of the population mean is different from at least of the population

 so the null hypothesis will be rejected