Optiions:
1.
a. The histogram
b. The box plot
2.
a. The histogram
b. The box plot
Answer:
(a) The correct option is (A).
(b) The correct option is (B).
Step-by-step explanation:
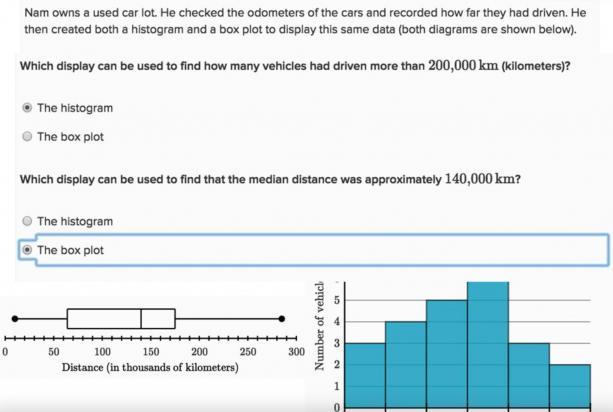
Nam collected the data for the distance traveled by all the cars in his car lot.
(a)
A histogram is a bar graph representing the distribution of a random variable. The height of the bars of the histogram represents the frequency for a specific interval.
If Nam wants to know how many vehicles had driven more than 200,000 km, the histogram would be the best display of this data. This is because the histogram shows the frequency for various interval values.
The correct option is (A).
(b)
A boxplot, also known as a box and whisker plot is a method to demonstrate the distribution of a data-set based on the following 5 number summary,
Minimum (shown at the bottom of the chart)
First Quartile (shown by the bottom line of the box)
Median (or the second quartile) (shown as a line in the center of the box)
Third Quartile (shown by the top line of the box)
Maximum (shown at the top of the chart).
So, if Nam wants to find whether the median distance was approximately 140,000 km, a box plot would be a better choice. This is because the box plot represents the median of the data by a line within the box.
The correct option is (B).
 27
27