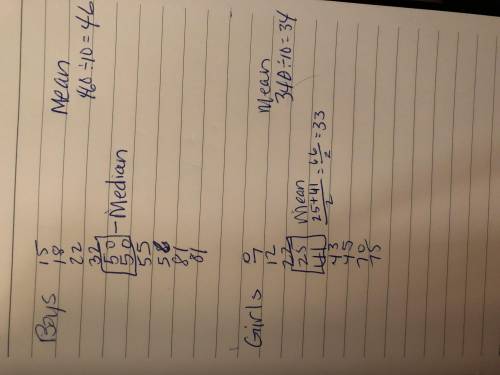
A: The girls have a median of 50 and a mean of 46, whereas the boys have a median of 33 and a mean of 34. Mean being the average number, we can assume that on average, it is the sixth grade girls that have downloaded more music, with a mean of 46, which is larger than 34 of the boys. The median for the girls at 50 is also larger then 33 for the boys, and the median means the middle most number of the data. So therefore, the girls have downloaded more overall songs in the past two months on their media player then the boys. Additionally, the mode for girls is 50 and 81, whereas the boys have no specific mode.
B: For the girls, the range is 66, and for the boys the range is 75. Due to the boys having a larger range, this must mean that the boy’s data set is more varied than the girls. Regarding the girls data set, the lower quartile is 22, the upper is 56, and the interquartile range is 34. For the boys the lower quartile is 12, the upper is 45, and the IQ range is 33. The IQ range’s being very similar show that for both data sets, the middle values are the same amount spread out within that middle 50% of the data. The mean absolute deviation for the girls is 19.4, and for the boys it is 20.8. The boys having a larger MAD then the girls mean that the boys have a larger variability in their data set of how many songs were downloaded.
C: I believe that it is possible to make valid conclusions based on the data collected, but there were only 10 data points collected for each group, and it would be more beneficial to have a larger sample size to get more accurate information. It is good that the survey was considered random, but there are many possible errors that could occur in such a situation. The sixth graders may not accurately remember how many total songs from the past two months they downloaded, though it did seem as if it was showing accurate data so they may have been able to look at their media player to check, which would be better. As long as the conclusions made are only referring to sixth graders and not a larger population, then depending on the conclusion made it can be valid.
Step-by-step explanation:
edg2020. Change the wording.
 4
4