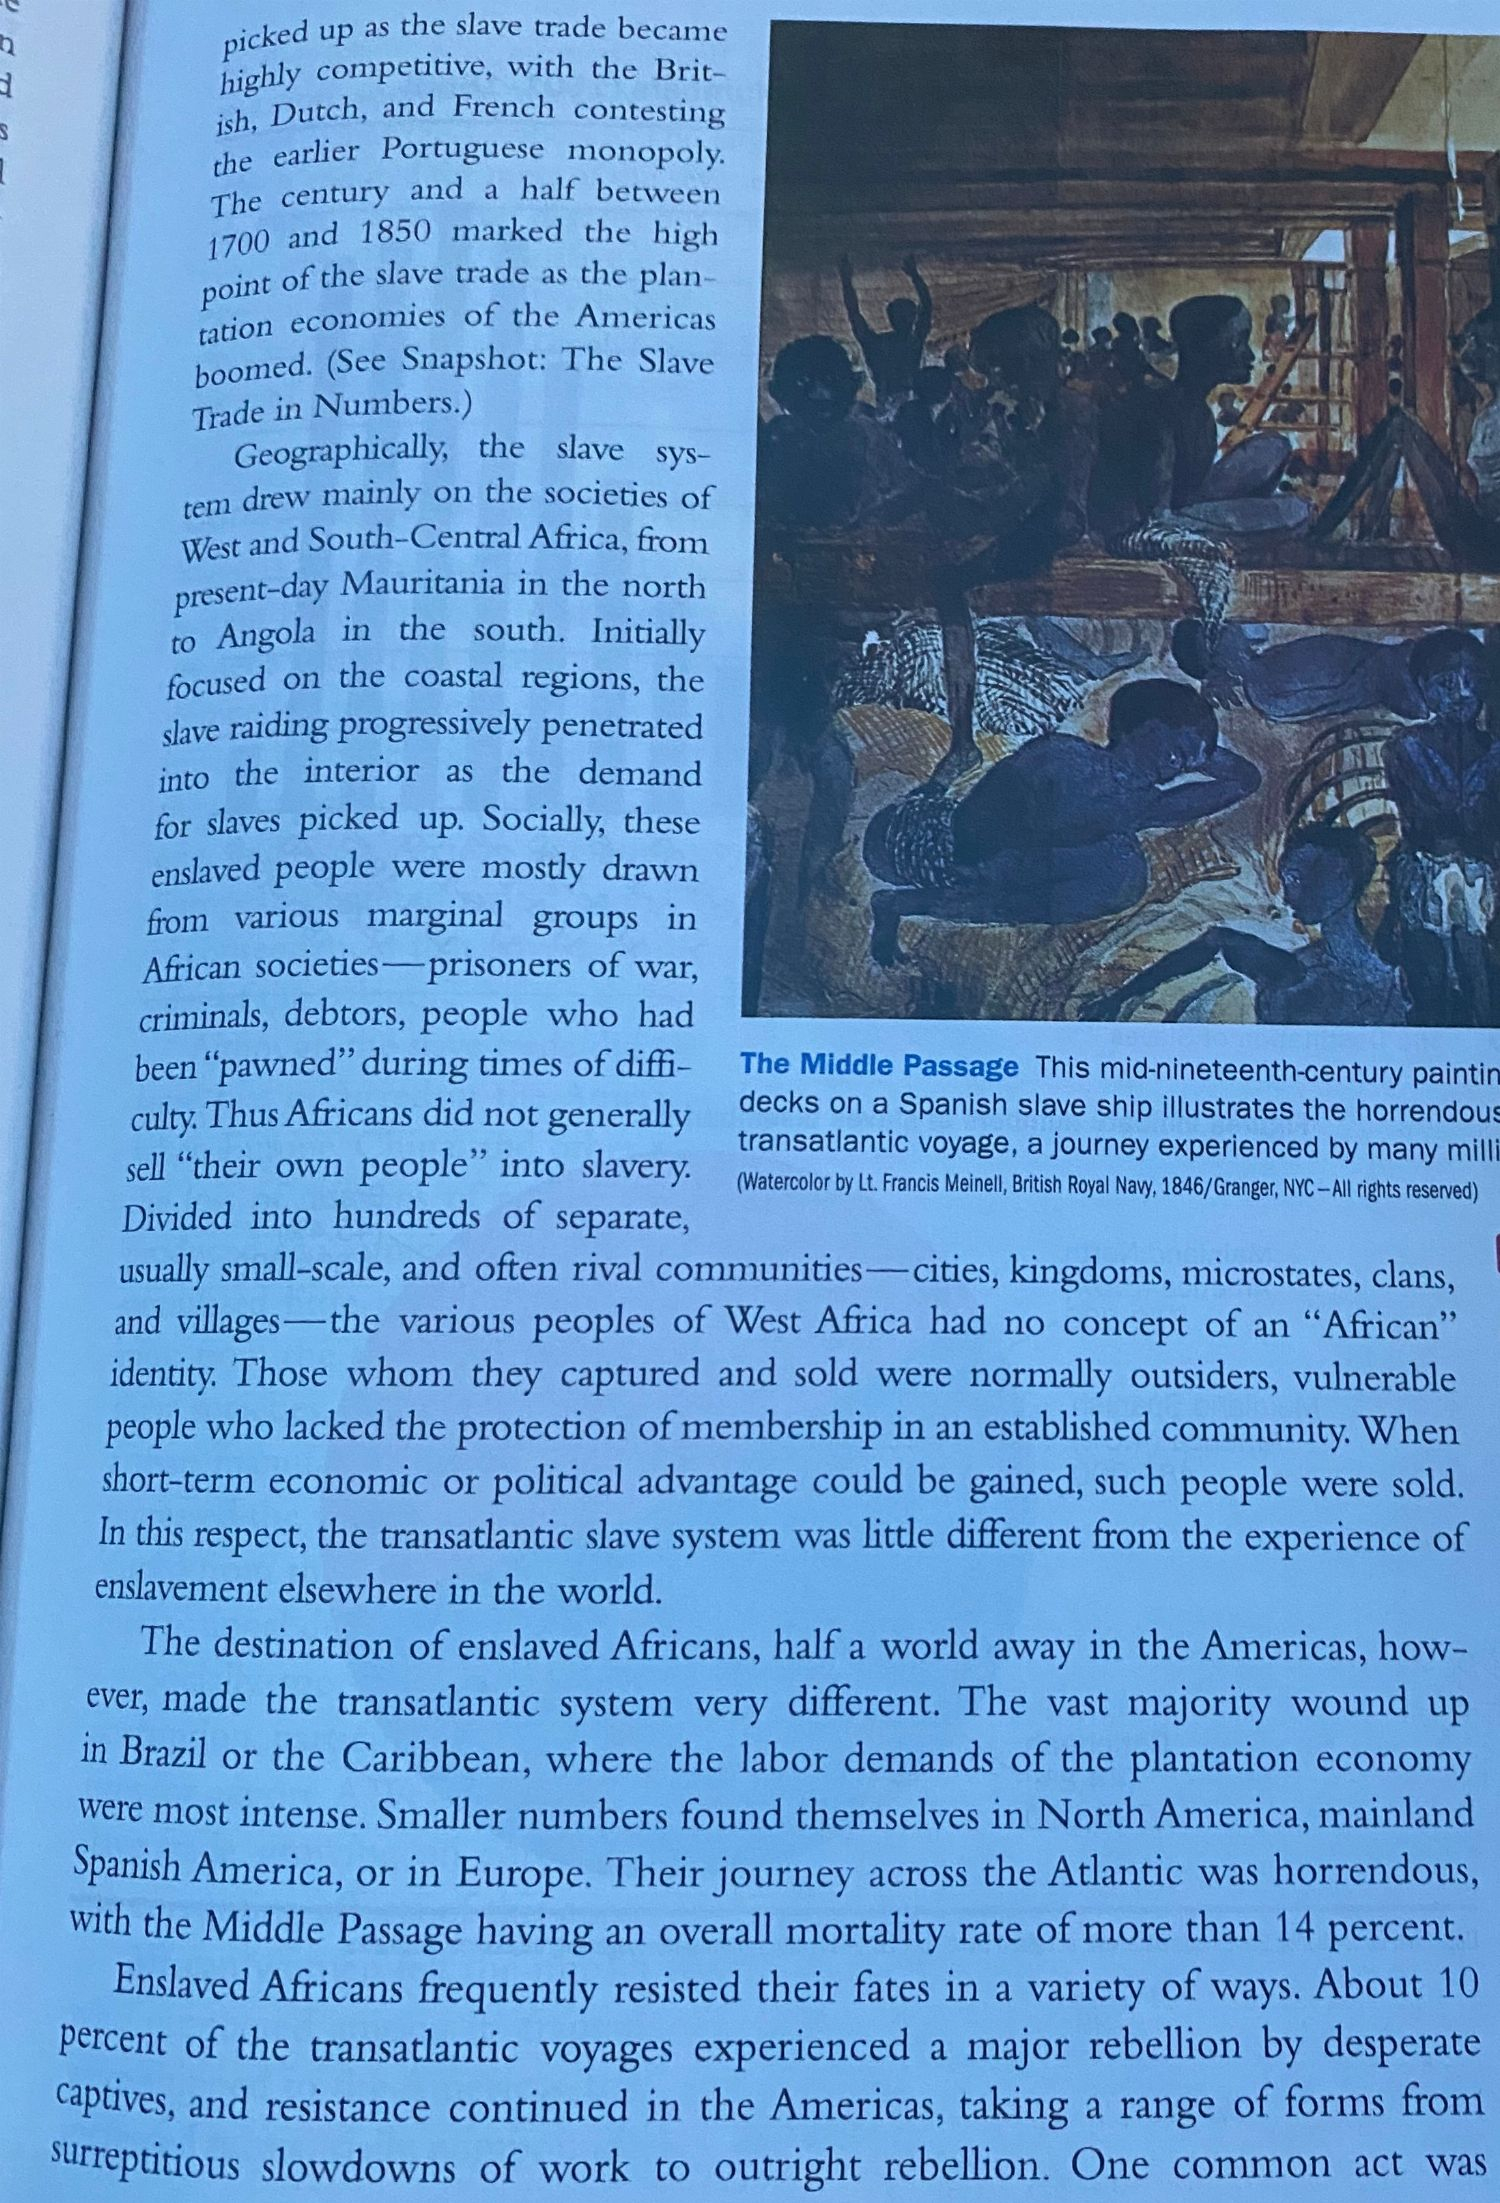
The graph below shows the numbers of cups of mango juice that are mixed with different numbers of cups of lemon-lime soda to make servings of mango soda:
A graph is shown. The values on the x-axis are 0, 1, 2, 3, 4, 5. The values on the y axis are 0, 10, 20, 30, 40, 50. Points are shown on ordered pairs 0, 0 and 1, 10 and 2, 20 and 3, 30 and 4, 40. These points are connected by a line. The label on the x-axis is Lemon-lime soda in cups. The title on the y axis is Mango juice in cups.