1) 
The sample variance can be calculated with this formula:

And we got:

And the sample deviation would be:

2) 
And we got:

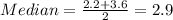
The median since we have 10 values would be the average between the 5th and 6th observations from the dataset ordered and we got:
And finally the mode would be the most repated value and we got:

3) 
So then we can conclude that probably this distirbution is left skewed
Step-by-step explanation:
We have the following dataset given:
1.1, 5.2, 3.6, 5.0, 4.8, 1.8, 2.2, 5.2, 1.5, 0.8
Part 1
We can order the dataset on increasing way and we got:
0.8 1.1 1.5 1.8 2.2 3.6 4.8 5.0 5.2 5.2
The range can be calculated like this:
The sample variance can be calculated with this formula:
And we got:
And the sample deviation would be:
Part 2
The mean can be calculated with this formula:
And we got:
The median since we have 10 values would be the average between the 5th and 6th observations from the dataset ordered and we got:
And finally the mode would be the most repated value and we got:
Part 3
For this case we know that:
So then we can conclude that probably this distirbution is left skewed
 11
11

