
So the p value obtained was a very low value and using the significance level given  we have
  so we can conclude that we have enough evidence to reject the null hypothesis, and we can said that at 1% of significance the proportion of students who will correctly identify the color is different than 0.5
Step-by-step explanation:
Data given and notation
n=121 represent the random sample taken
X=97 represent the people who identify the color of the gummy bear
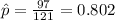 estimated proportion of people who identify the color of the gummy bear
 is the value that we want to test
represent the significance level
Confidence=99% or 0.99
z would represent the statistic (variable of interest)
 represent the p value (variable of interest)
Part a
For this case the parameter that we want to test is 0.5 for the proportion of the population of students will correctly identify the color
Part b: Concepts and formulas to use
We need to conduct a hypothesis in order to test the claim that there is no relationship between color and gummy bear flavor (population proportion different from 0.5).:
Null hypothesis:
Alternative hypothesis:
When we conduct a proportion test we need to use the z statistic, and the is given by:
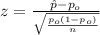 (1)
(1)
The One-Sample Proportion Test is used to assess whether a population proportion  is significantly different from a hypothesized value
  .
.
Part c: Calculate the statistic
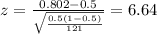
Since we have all the info requires we can replace in formula (1) like this:
Statistical decision
It's important to refresh the p value method or p value approach . "This method is about determining "likely" or "unlikely" by determining the probability assuming the null hypothesis were true of observing a more extreme test statistic in the direction of the alternative hypothesis than the one observed". Or in other words is just a method to have an statistical decision to fail to reject or reject the null hypothesis.
The significance level provided . The next step would be calculate the p value for this test.
Since is a right tailed test the p value would be:
So the p value obtained was a very low value and using the significance level given we have so we can conclude that we have enough evidence to reject the null hypothesis, and we can said that at 1% of significance the proportion of students who will correctly identify the color is different than 0.5
 6
6

