Geography : asked on wheelercr
 14.02.2020

The chart shows how climate change and rising ocean temperatures might affect the types of hurricanes we see this century. The bars show the results from different math models used to make the predictions.

Category 1 includes the least powerful hurricanes. Categories 2 and 3 are moderate hurricanes. Categories 4 and 5 include the most powerful hurricanes.

Bar graph with percentage change over 21st century on the y-axis and Topical storm plus category 1 Hurricane from 0 to minus 30, has 3 bots in blue, category 2 plus 3 hurricanes is marked at (0 to minus 26) has four dots, category 4 plus 5

Classify the questions based on whether they can or cannot be answered by the chart.
Which type of hurricane is
expected to strike more
frequently this century?
How are hurricanes
formed in the
atmosphere?

In general, will hurricanes
likely become stronger or
weaker this century?
Which areas are at
the highest risk for
hurricanes?
Which types of hurricanes
are expected to drop in
frequency by more than
25% this century?
How many category 4
and 5 hurricanes can
we expect this century?

. 2

Answer to test

14.11.2022, solved by verified expert
Unlock the full answer

A) From the chart, only category 4 & 5 hurricanes are predicted to have a positive percent change in number, hence, they are the ones expected to strike more frequently in this century.

B) This information cannot be read off from the graph. So, the answer provided isn't from this chart of prediction.

Hurricanes are formed when warm, moist air from the ocean surface begins to rise rapidly, and they encounter cooler air that forces the warm water vapor to condense& form storm clouds with drops of rain.

C) The less powerful hurricanes are predicted to have more than 25% negative percent change in number.

But the most powerful categories of hurricanes are predicted to have more than 75% positive percent change in number.

Although, the true figures aren't clear, but more hurricanes that happen are bound to be classified as category 4 & 5 hurricanes. It can be perceived that hurricanes are getting stronger in this century.

D) This information cannot be read off from this chart. It isn't provided.

E) From the chart, category 1 and category 2 & 3 hurricanes are predicted to drop in frequency by more than 25% this century.

F) From the chart, we're predicted to have more than 75% positive percent increase in the number of category 4 & 5 hurricanes.

The number of category 4 and 5 hurricanes we should expect this century will be more than 75% higher than the previous century.

It is was helpful?

Faq

StudenGPT
Step-by-step answer
P Answered by Studen AI
Based on the information provided on the chart, we can classify the questions into two categories: "Can Be Answered Using the Chart" and "Cannot Be Answered Using the Chart."

Can Be Answered Using the Chart:
1. Which type of hurricane is expected to strike more frequently this century?
Justification: The chart shows the percentage change over the 21st century for different types of hurricanes. By comparing the bars representing different categories of hurricanes, we can determine which type is expected to occur more frequently.

2. Which areas are at the highest risk for hurricanes?
Justification: The chart does not directly provide information about specific areas at risk, but it presents how climate change and rising ocean temperatures might affect the types of hurricanes. Generally, areas near coastlines and regions prone to tropical storms often face higher risks for hurricanes. These patterns can help in understanding which areas might be at a higher risk based on the projected changes shown in the chart.

3. Which types of hurricanes are expected to drop in frequency by more than 25% this century?
Justification: By examining the percentage change over the 21st century for the different categories of hurricanes, we can identify which types are expected to decrease by more than 25%.

4. In general, will hurricanes likely become stronger or weaker this century?
Justification: The chart displays the projected effects of climate change and rising ocean temperatures on various hurricane categories. By analyzing the bars representing each category, we can determine whether hurricanes are expected to become stronger or weaker.

Cannot Be Answered Using the Chart:
1. How are hurricanes formed in the atmosphere?
Justification: The chart does not provide information regarding the formation of hurricanes. Understanding how hurricanes are formed requires knowledge of atmospheric conditions, such as warm water, low-pressure systems, and the Coriolis effect.

2. How many category 4 and 5 hurricanes can we expect this century?
Justification: The chart does not include specific numbers or counts of hurricanes. It only displays the percentage change over the 21st century for different hurricane categories, but it does not provide specific numerical data.

In conclusion, several questions can be answered using the chart, such as those related to the expected frequency and changes in hurricane categories. However, questions related to hurricane formation and specific numerical counts of hurricanes cannot be answered using the given chart.
StudenGPT
Step-by-step answer
P Answered by Studen AI
Based on the given chart, we can classify the questions as follows:

Can Be Answered Using the Chart:
1. Which type of hurricane is expected to strike more frequently this century?
The chart shows a % Change over the 21st Century. We can compare the bars representing each hurricane category to determine which category is expected to increase in frequency.

2. Which areas are at the highest risk for hurricanes?
The chart does not explicitly show geographical information, but we can infer that areas experiencing an increase in the frequency of hurricanes (such as Category 4+5 hurricanes) might be at higher risk.

3. Which types of hurricanes are expected to drop in frequency by more than 25% this century?
By comparing the bars representing different hurricane categories, we can identify the categories that show a decrease of more than 25% in expected frequency.

Cannot Be Answered Using the Chart:
1. How are hurricanes formed in the atmosphere?
The chart does not provide information about the formation of hurricanes. To answer this question, we would need a different source explaining the atmospheric conditions required for hurricane formation.

2. In general, will hurricanes likely become stronger or weaker this century?
The chart only provides information about the frequency of hurricanes, not their strength. To answer this question, we would need additional data or a different source that specifically discusses the expected changes in hurricane strength.

3. How many Category 4 and 5 hurricanes can we expect this century?
The chart does not provide specific numbers or counts for the expected number of Category 4 and 5 hurricanes. To determine the exact count, we would need access to the data or specific information from the math models used to make the predictions.
Chemistry
Step-by-step answer
P Answered by Master
The answers are the following that can be answered using the chart:

A. Which type of hurricane is expected to strike more frequently this century?
Category 4 + 5C. In general, will hurricanes likely become stronger or weaker this century?
Stronger, because there are more stronger ones thant he weaker ones that can result to hurricane.

E. Which types of hurricanes are expected to drop in frequency by more than 25% this century?
Categories 1, 2, 3
Physics
Step-by-step answer
P Answered by PhD
Answers:
A. can be proven from the graph
B. cant be proven
C. can be proven
D. cant be proven
E. can be proven
F. can be proven)

Explanation:
The chart to be used to answer the question is currently missing. After obtaining online, I have attached it to this solution of this question.
From the graph, the prediction shows a negative percent change in the number of category 1 and category 2 & 3 hurricanes (greater than -25% change) and category 4 & 5 hurricanes get a positive percent change of more than +75% change)

Now, taking the statements, one at a time.
A. Which type of hurricane is expected to strike more frequently this century?
From the chart, only category 4 & 5 hurricanes are predicted to have a positive percent change in number, hence, they are the ones expected to strike more frequently in this century.

B) How are hurricanes formed in the atmosphere?
This information cannot be read off from the graph. So, the answer provided isn't from this chart of prediction.
Hurricanes are formed when warm, moist air from the ocean surface begins to rise rapidly, and they encounter cooler air that forces the warm water vapor to condense& form storm clouds with drops of rain.

C) In general, will hurricanes likely become stronger or weaker this century?
The less powerful hurricanes are predicted to have more than 25% negative percent change in number.
But the most powerful categories of hurricanes are predicted to have more than 75% positive percent change in number.
Although, the true figures aren't clear, but more hurricanes that happen are bound to be classified as category 4 & 5 hurricanes. It can be perceived that hurricanes are getting stronger in this century.

D) Which areas are at the highest risk of hurricanes?
This information cannot be read off from this chart. It isn't provided.

E) Which types of hurricanes are expected to drop in frequency by more than 25% this century?
From the chart, category 1 and category 2 & 3 hurricanes are predicted to drop in frequency by more than 25% this century.

F) How many category 4 and 5 hurricanes can we expect this century?
From the chart, we're predicted to have more than 75% positive percent increase in the number of category 4 & 5 hurricanes.
The number of category 4 and 5 hurricanes we should expect this century will be more than 75% higher than the previous century.
Answers:
A. can be proven from the graph
B. cant be proven
C. can be proven
D. cant be proven
E
Geography
Step-by-step answer
P Answered by Master
Answer and explanation: This is a Robinson map of the world. The Robinson projection was created in 1963 by the geographer Arthur Robinson. The projection seeks to balance different types of distortion. The projection isn't perfect, but it is considered more visually appealing than others. It balances small distortions of area, shape, distance, and direction.
Answer and explanation: This is a Robinson map of the world. The Robinson projection was created in
Geography
Step-by-step answer
P Answered by PhD

Thus question lacks a picture or option, but nevertheless:

Answer:

There are 3 types of friction:1) Static friction - when you apply force and the object does not move.2) Sliding friction - when the surface if the object moves on other.3) Rolling friction - when any wheel or ball moves on any surface rolling friction is applied. it is very less than sliding friction.

Geography
Step-by-step answer
P Answered by PhD

Options:

A. They standardize prices for commodities in global markets 

B. They streamline the process of organizational decision making. 

C. They force organizations to reach a consensus before making decisions 

D. They provide a forum for individuals to voice discontent with organizations.​

Answer:

B. They streamline the process of organizational decision making. 

Explanation:

A geographic information system (GIS) is a type of database containing geographic data (that is, descriptions of phenomena for which location is relevant), combined with software tools for managing, analyzing, and visualizing those data. In a broader sense, one may consider such a system to also include human users and support staff, procedures and workflows, body of knowledge of relevant concepts and methods, and institutional organizations.

Options:A. They standardize prices for commodities in global markets B. They streamline the pro
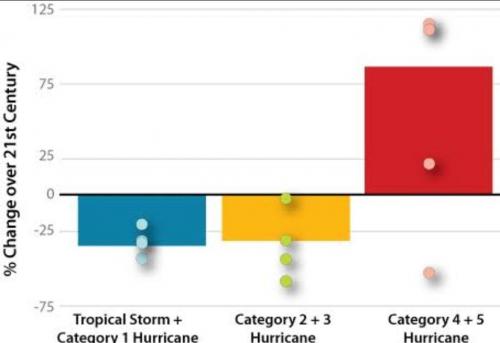
[youtube=iCHaJR831t4]
Geography
Step-by-step answer
P Answered by PhD

Answer:

More refugees fled Southeast Asia when Vietnam invaded Cambodia in 1979 to overthrow the murderous regime of Pol Pot. Thousands of refugees from that unhappy land began to escape over the border into neighboring Thailand.

Also the majority of Vietnamese came to Victoria after the Communist government took over their homeland at the end of the Vietnam War. Those already in Australia were offered permanent residence, and refugees began to be admitted through resettlement camps based in South East Asia.
 

Geography
Step-by-step answer
P Answered by PhD

Answer:

When birds are hungry, they will peck unripened fruit. Also, if there is no other fruit around, the birds might go after unripened fruit. Heavy bird pecking can be used as an indicator that it's ready to start harvesting.

Birds need food to eat, and plants need to disperse their seeds. Fruit-eating animals are called frugivores, and birds are the most important frugivores of all. More than 300 trees, shrubs, and vines in North America have small fruits that depend on birds for seed dispersal.

Try asking the Studen AI a question.

It will provide an instant answer!

FREE