The interquartile range of the players' weights = 48 pounds.
Step-by-step explanation:
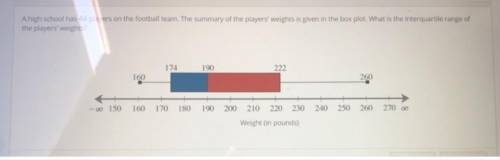
The boxplot attached to this question is missing. It was obtained online and is attached to this solution of the question.
It should be noted that the following is true for a boxplot.
A box plot gives a visual representation of the distribution of the data, showing where most values lie and those values that greatly differ from the rest, called outliers.
The elements of the box plot are described thus;
The bottom side of the box represents the first quartile, and the top side, the third quartile. Therefore, the width of the central box represents the inter-quartile range.
The horizontal line inside the box is the median.
The lines extending from the box reach out to the minimum and the maximum values in the data set, as long as these values are not outliers. The ends of the whiskers are marked by two shorter horizontal lines.
Variables in the dataset, higher than Q3+(1.5×IQR) or lower than Q1-(1.5×IQR) are considered outliers and are usually shown using dots above the top whisker or below the bottom whisker.
So, it is evident that for this question,
First quartile = 174 pounds
Third quartile = 222 pounds
Inter Quartile Range = (Third quartile) - (First quartile)
= 222 - 174
= 48 pounds.
Hope this Helps!!!
 5
5