1. For us to know the answer to this, we just need to examine the table of data. Looking at it, we can rule out the linear trend since the growth of the population rose from 77 to 104 in just one year. This sudden spike alone would tell us that the trend of the growth of the rabbit's population is exponential.
2. To make the scatterplot of the data, we just need to plot the given points in a coordinate plane where the number of rabbits is in the y-axis and the year is in the x-axis. For this problem though, I do not need to attach a plot anymore since you have already given it in your attachments. The scatterplot would just be what you have attached minus the red lines that were used to model the equation (since that is for a later item).
3. We have previously identified the data to be exponential, and looking at the scatterplot would just confirm this. Therefore, for us to model the data accurately, we would need to make use of the exponential regression equation.
4. For this item I just used a calculator online. For the quadratic equation, we just need to find the constants in the equation
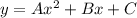
. Substituting the data into the calculator we get the equation:

.
5. In here, the problem is just telling us to use the equation in item #4 to calculate or estimate the number of rabbits in 70 years. Therefore, we just substitute the value (70) to the variable x (in the previous equation, x represents the year while y represents the number of rabbits).

6. I used the same calculator I did in item #4 for this item. In an exponential regression equation we just need to find the constants in the equation

. According to the calculator, the exponential regression equation is
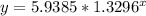
7. For this item, we do the same thing that we did in item #5 but this time we substitute the value to the equation in item #6. Since the problem is still asking us to predict the number of rabbits in 70 years, we substitute this value again to x.

8. This question is self-explanatory and we are only being tasked to look at our answers in items #5 and #7 to compare which one of them is larger. Clearly, our prediction in item #7 significantly exceeds our prediction in item #5, therefore this is our larger prediction.
9. Yes, of course. As long as the data was gathered correctly, we have enough points that will allow us to determine the possible trend of the variable as well as its possible values in the future years. While adding more points would improve the prediction, our current dataset would suffice.
10a. By looking at the graphs that you attached, we can clearly see that the exponential model follows all data points. While the quadratic model still hits most points and could even be regarded accurate, its different trend would lead us to infer that the model will go off course in the future values.
10b. Our answer in item #10a is actually the same as our answer in item #1. So in a way, we can confidently say that our initial choice was correct. The similarity in the answers proves that our reasoning in the first item and the previous item support each other.
11a. Our answer predicts that there will almost be 3 billion rabbits after 70 years. While this is relatively low compared to the estimated 10 billion rabbits in the video, this is closer than the 5,689 rabbits estimated by the quadratic model.
11b. The rabbit population in Australia grew exponentially because each offspring is bound to introduce one or more rabbits into the population. This creates endless and fast-growing branches in a family tree that will only go faster as the rabbits grow in number. Without anything to stop them (since they were not made for that environment in the first place. i.e. no competitors), they can grow uninterrupted.
11c. The environment and everyone around the rabbits can hinder their population from growing infinitely large. A most effective hindrance would be the introduction of a competitor or a predator. With someone competing for resources or actively hunting them down, their population would surely see a stop/ a decline. Other factors include diseases, food, natural disasters, etc.
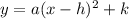
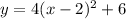


 ----> open upward (vertex is a minimum)
 5
5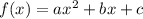 . The vertex,
  of a quadratic function is determined by the formula:
  and
and  ; where
  is the x-coordinate of the vertex and
  is the y-coordinate of the vertex. The value of
  determines if the parabola opens upward or downward; if

