for Derek's collection :
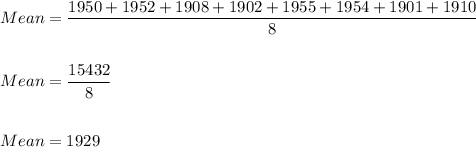
Mean= 1929
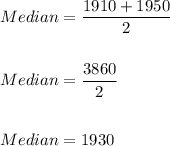
Median= 1930
Range= 54
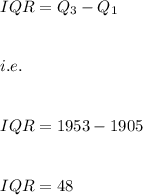
IQR = 48
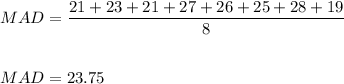
MAD= 23.75
for Paul's collection:
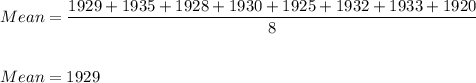
Mean= 1929
Median= 1929.5
Range= 15
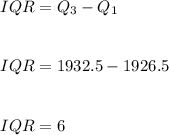
IQR = 6
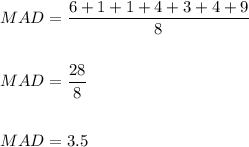
MAD= 3.5
Step-by-step explanation:
Derek's collection:
1950, 1952, 1908, 1902, 1955, 1954, 1901, 1910
Mean is given by:
Now absolute deviation from mean is:
|1950-1929|= 21
|1952-1929|= 23
|1908-1929|= 21
|1902-1929|= 27
|1955-1929|= 26
|1954-1929|= 25
|1901-1929|= 28
|1910-1929|= 19
and the mean of these absolute deviation gives the MAD of the data i.e.
Now, on arranging the data in increasing order we get:
1901 1902 1908 1910 1950 1952 1954 1955
The least value is: 1901
Maximum value is: 1955
Range is: Maximum value-Least value
Range=1955-1901
Range= 54
Also, the median lie between 1910 and 1950 and is calculated as:
Also, the lower set of data is:
1901 1902 1908 1910
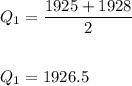
and the median of lower set of data also known as first quartile or lower quartile is:
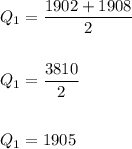
and upper set of data is:
1950 1952 1954 1955
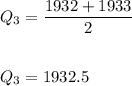
and the median of upper set of data i.e. upper quartile or third quartile is:
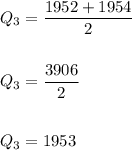
Hence, IQR is calculated as:
Paul's collection:
1929, 1935, 1928, 1930, 1925, 1932, 1933, 1920
Mean is given by:
Now absolute deviation from mean is:
|1929-1929|=0
|1935-1929|= 6
|1928-1929|= 1
|1930-1929|= 1
|1925-1929|= 4
|1932-1929|= 3
|1933-1929|= 4
|1920-1929|= 9
Hence, we get:
Now, on arranging the data in increasing order we get:
1920 1925 1928 1929 1930 1932 1933 1935
Least value= 1920
Maximum value= 1935
Range= 15 ( Since, 1935-1920=15 )
The median lie between 1929 and 1930
Hence, Median= 1929.5
Also, lower set of data is:
1920 1925 1928 1929
and median of lower set of data is the first quartile or upper quartile and is calculated as:
and the upper set of data is:
1930 1932 1933 1935
Hence, we get:
Hence, IQR is calculated as:
 5
5