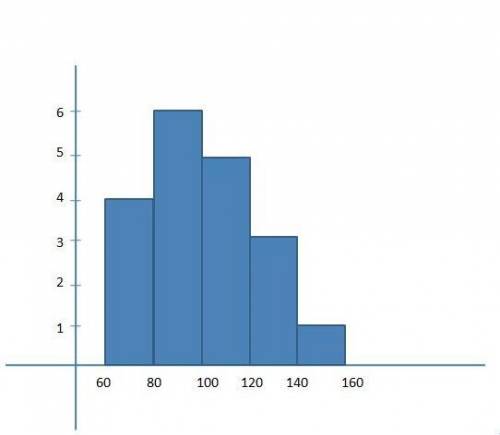
The students in Marly’s math class recorded the dimensions of their bedrooms in a frequency table.
2-column table with 5 rows. First column labeled area (square feet) with entries 60 is less than or equal to A is less than 80, 80 is less than or equal to A is less than 100, 100 is less than or equal to A is less than 120, 120 is less than or equal to A is less than 140, 140 is less than or equal to A is less than 160. Second column labeled number of rooms with entries 4,6,5,3,1.
Create a histogram to represent the data. Which statement is most likely true about the mean and the median of the data?
The histogram is right-skewed, so the mean is less than the median.
The histogram is right-skewed, so the mean is greater than the median.
The histogram is left-skewed, so the mean is less than the median.
The histogram is left-skewed, so the mean is greater than the median.