Step-by-step explanation:
From the given information:
For trained subjects:
sample size  = 1200
The sample mean  = 789
= 789
For non-trained subjects:
Sample size  = 1200
The sample mean = 632
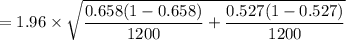
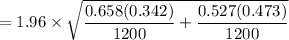
For trained subjects, the proportion who repaid the loan is:


For non-trained loan takers, the proportion who repaid the loan was:


The confidence interval for the difference between the given proportion is:
= ![[ ( \hat p_1 - \hat p_2 ) - E \ , \ (\hat p_1 - \hat p_2 ) + E ]](/tpl/images/1008/1836/1de83.png)
where;
Level of significance = 1 - C.I
= 1 - 0.95
= 0.05
Z - Critical value at ∝ = 0.05 is 1.96
The Margin of Error (E) = 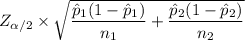

= 1.96 × 0.019881
≅ 0.039
The lower limit = 
= (0.658 - 0.527) - 0.0389
= 0.131 - 0.0389
= 0.092
The upper limit = 
= (0.658 - 0.527) + 0.0389
= 0.131 + 0.0389
= 0.167
Thus, 95% C.I for the difference between the proportion of trained and non-trianed loan takers who repaired the loan is:

For this study;
The null hypothesis is:

The alternative hypothesis is:
Since the C.I lie between (0.092, 0.17);
And the null hypothesis value does not lie within the interval (0.092, 0.17).
∴
we reject the null hypothesis  at ∝(0.05).
Conclusion: We conclude that there is enough evidence to claim that the proportion of trained and non-trained loan takers who repaired the loan are different.
 10
10