15.10.2022

Please help me with this #5

. 0

Faq

Mathematics
Step-by-step answer
P Answered by Master

Step-by-step explanation:

Hello!

You have the data on 443 rounds of golf played on the 12th hole.

The variable of interest is:

X: score of one round of golf played on the 12th hole.

To construct the empirical distribution of the discrete variable you have to organize the data from least to highest and count how many times each score was recorded, establishing the absolute frequency for each value of the variable.

a. Check attachment.

fi= absolute frequency

Fi= accumulated absolute frequencies

hi= relative frequency

Hi= accumulated relative frequency

b.

P(X≤4)

This is the probability of the player scoring "4 or less", so it includes the probability of the player scoring 3 and the player scoring 4, symbolically:

P(X≤4)= P(X=3)+P(X=4)= H(4)= 0.136

c.

The expected score of a discrete variable is:

E(X)= [∑(Xi*fi)]/n= 2343/443= 5.29

d.

To calculate the variance of the variable you have to use the following formula:

V(X)= 1/(n-1)*[∑(Xi²*fi)-(∑(Xi*fi)²]/n)] = (1/442)*[12831-(2343²/443)]

V(X)= 0.993

e.

The standard deviation is the square root of the variance:

√V(X)=√0.993= 0.994

I hope it helps!


During the summer of 2014, Coldstream Country Club in Cincinnati, Ohio collected data on 443 rounds
Mathematics
Step-by-step answer
P Answered by Specialist

400 NUMBERS. I WENT THROUGH AND TOOK OUT ALL THE 5's AND 6's AND THEN I PUT IT THROUGH A WORD COUNTER AND GOT 400

Step-by-step explanation:

3 2  2  2 4 2 3

2 2  3  1  4

2 2  3 2  4  3 3

1 1 2 1 3  3 3 2 3

3 3 3  2 1 3 1

4  2  4 4  1

1 1 1  1 2 1 4 2

3 2 4 3 4  3 2 2 3

4 1  3 2 3  3 3

3 2 4 2 3 4 3  1 4

4 3 1  3 2 3 2  4

2 4 3  1  2 3

3 3 1  1 3 4 2

1 3  3 4 2  4 4 4

1  1 3 3 4 1 2 4

4 4 4

2 3 4  3 1  1

2 2 4  4 1 1 1 2 3

3  3 2

3 3 3 2 3 1 1

3 4 1 3  3

3 4 2  2 4 1

3  4  4

4  2 4 3 2 4

1  4 4 1 2  1

4 3 4  1 2  4

3  4 1  1 2 3 1 1

3 1 3 3 1  4 4 3 1

1 3 4 4 1 1  3 1

4 4 1  1  1

2 1 1  1 4 2 1

2  1 4  4 1  4 3

2 1  3 1 3 4 2 2 2

4 4 1  2 3  2

3  1 1  1  1

4  4 3  4

4  4  1 1 1  2

1  1 1 3 2 2  1

4 1  2  2  2 2

3 1 2  2 1 3 4 2

1 3 1 1 4  4 1 1 2

1 3 4 3 4 2 2 3 3

1  4 1 3 1 1 4 2

4 4 4 1 1  4

3  1 4  2  1

2  1 1 2  3  3

1 3  2  1  3

1 4 1 2  1 1 3

2 4 4 2 1  2 2 2

4 2 2  4 1 3  2

1 4 1 1

4  4  1 1  4  2

2 2 2 2 3  1 3 3

4  1 4 4 1 4  1

3  2 1 1 3 1 2 4 4

4 1  4  1 5 3

3  2 2  2  4

1 4  3 4 3  2

3 3 2 4 2  2

4 1  3 4 3 1 2 4


How many numbers are lower than 5

3 2 5 2 6 6 2 4 2 3
2 2 6 6 3 6 6 1 6 4
2 2 6 3 2 6 4 5 3 3
1 1 2
Mathematics
Step-by-step answer
P Answered by Master

400 NUMBERS. I WENT THROUGH AND TOOK OUT ALL THE 5's AND 6's AND THEN I PUT IT THROUGH A WORD COUNTER AND GOT 400

Step-by-step explanation:

3 2  2  2 4 2 3

2 2  3  1  4

2 2  3 2  4  3 3

1 1 2 1 3  3 3 2 3

3 3 3  2 1 3 1

4  2  4 4  1

1 1 1  1 2 1 4 2

3 2 4 3 4  3 2 2 3

4 1  3 2 3  3 3

3 2 4 2 3 4 3  1 4

4 3 1  3 2 3 2  4

2 4 3  1  2 3

3 3 1  1 3 4 2

1 3  3 4 2  4 4 4

1  1 3 3 4 1 2 4

4 4 4

2 3 4  3 1  1

2 2 4  4 1 1 1 2 3

3  3 2

3 3 3 2 3 1 1

3 4 1 3  3

3 4 2  2 4 1

3  4  4

4  2 4 3 2 4

1  4 4 1 2  1

4 3 4  1 2  4

3  4 1  1 2 3 1 1

3 1 3 3 1  4 4 3 1

1 3 4 4 1 1  3 1

4 4 1  1  1

2 1 1  1 4 2 1

2  1 4  4 1  4 3

2 1  3 1 3 4 2 2 2

4 4 1  2 3  2

3  1 1  1  1

4  4 3  4

4  4  1 1 1  2

1  1 1 3 2 2  1

4 1  2  2  2 2

3 1 2  2 1 3 4 2

1 3 1 1 4  4 1 1 2

1 3 4 3 4 2 2 3 3

1  4 1 3 1 1 4 2

4 4 4 1 1  4

3  1 4  2  1

2  1 1 2  3  3

1 3  2  1  3

1 4 1 2  1 1 3

2 4 4 2 1  2 2 2

4 2 2  4 1 3  2

1 4 1 1

4  4  1 1  4  2

2 2 2 2 3  1 3 3

4  1 4 4 1 4  1

3  2 1 1 3 1 2 4 4

4 1  4  1 5 3

3  2 2  2  4

1 4  3 4 3  2

3 3 2 4 2  2

4 1  3 4 3 1 2 4


How many numbers are lower than 5

3 2 5 2 6 6 2 4 2 3
2 2 6 6 3 6 6 1 6 4
2 2 6 3 2 6 4 5 3 3
1 1 2
Mathematics
Step-by-step answer
P Answered by Specialist

Step-by-step explanation:

Hello!

You have the data on 443 rounds of golf played on the 12th hole.

The variable of interest is:

X: score of one round of golf played on the 12th hole.

To construct the empirical distribution of the discrete variable you have to organize the data from least to highest and count how many times each score was recorded, establishing the absolute frequency for each value of the variable.

a. Check attachment.

fi= absolute frequency

Fi= accumulated absolute frequencies

hi= relative frequency

Hi= accumulated relative frequency

b.

P(X≤4)

This is the probability of the player scoring "4 or less", so it includes the probability of the player scoring 3 and the player scoring 4, symbolically:

P(X≤4)= P(X=3)+P(X=4)= H(4)= 0.136

c.

The expected score of a discrete variable is:

E(X)= [∑(Xi*fi)]/n= 2343/443= 5.29

d.

To calculate the variance of the variable you have to use the following formula:

V(X)= 1/(n-1)*[∑(Xi²*fi)-(∑(Xi*fi)²]/n)] = (1/442)*[12831-(2343²/443)]

V(X)= 0.993

e.

The standard deviation is the square root of the variance:

√V(X)=√0.993= 0.994

I hope it helps!


During the summer of 2014, Coldstream Country Club in Cincinnati, Ohio collected data on 443 rounds
Computers and Technology
Step-by-step answer
P Answered by Specialist

#include <stdlib.h>

#include <stdio.h>

void func1(int product[]){

int orders[6]={0};

for(int i=0;i<70;i++){

orders[product[i]]++;

}

printf("Total number of each type of products that were bought\n");

for(int i=1;i<=5;i++){

printf("Product %d = %d\n",i,orders[i]);

}

}

void func2(int product[],int quantity[],float price[]){

float total_cost=0;

for(int i=0;i<70;i++){

total_cost+= price[product[i]]* quantity[i];

}

printf("The total cost of all 70 orders = %.2f\n",total_cost);

}

void func3(int product[],int quantity[],int destination[],float price[]){

float total_cost=0;

for(int i=0;i<70;i++){

if(destination[i]==8){

total_cost+= price[product[i]]* quantity[i];

}

}

printf("The total cost of all products shipped to destination 8 = %.2f\n",total_cost);

}

void func4(int product[],int quantity[],float price[]){

int total_orders=0;

for(int i=0;i<70;i++){

if(price[product[i]]* quantity[i]>=50){

total_orders++;

}

}

printf("The total number of orders where each order is $50 or more = %d\n",total_orders);

}

void func5(int product[],int quantity[],int origination[],float price[]){

int total_orders=0;

for(int i=0;i<70;i++){

if(origination[i]==3 && price[product[i]]* quantity[i]>=50){

total_orders++;

}

}

printf("The total number of orders that originated from 3 where each order is $50 or more. = %d\n",total_orders);

}

void func6(int product[],int quantity[],int origination[],float price[]){

float total_cost=0;

for(int i=0;i<70;i++){

if(origination[i]==3 && price[product[i]] * quantity[i]>=50){

total_cost += price[product[i]] * quantity[i];

}

}

printf("The total number of orders that originated from 3 where each order is $50 or more. = %.2f\n",total_cost);

}

void func7(int origination[],int destination[]){

int total_orders=0;

for(int i=0;i<70;i++){

if(origination[i]==3 && destination[i]==8){

total_orders++;

}

}

printf("The total number of orders that originated from 3 and shipped to 8. = %d\n",total_orders);

}

void func8(int product[],int quantity[],int origination[],int destination[],float price[]){

float total_cost=0;

for(int i=0;i<70;i++){

if(origination[i]==3 && destination[i]==8){

total_cost += price[product[i]] * quantity[i];

}

}

printf("The total cost of orders that originated from 3 and shipped to 8. = %.2f\n",total_cost);

}

void func9(int destination[]){

int total_orders=0;

for(int i=0;i<70;i++){

if(destination[i]!=8){

total_orders++;

}

}

printf("The total number of orders that was shipped to all destinations except to 8. = %d\n",total_orders);

}

void func10(int product[],int quantity[],int destination[],float price[]){

float total_cost=0;

for(int i=0;i<70;i++){

if(destination[i]!=8){

total_cost += price[product[i]] * quantity[i];;

}

}

printf("The total cost of orders that was shipped to all destinations except to 8. = %.2f\n",total_cost);

}

int main(){

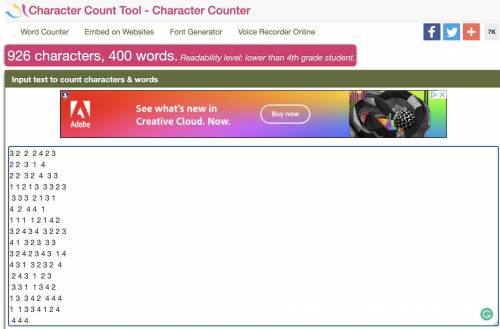
int product[70] = {4, 2, 4, 2, 4, 5, 5, 2, 2, 5, 5, 4, 3, 5, 4, 2, 5, 3, 1, 2, 2, 3, 3, 4, 5, 5, 4, 5, 3, 5, 5, 1, 4, 5, 1, 5, 3, 2, 4, 1, 2, 4, 5, 1, 5, 5, 5, 5, 5, 2, 5, 1, 4, 4, 4, 2, 3, 3, 3, 3, 4, 3, 5, 5, 3, 2, 3, 5, 3, 2};

int quantity[70] = {10, 9, 6, 4, 10, 4, 9, 6, 10, 7, 3, 4, 4, 9, 1, 8, 9, 1, 5, 8, 7, 2, 3, 4, 10, 5, 6, 2, 1, 7, 2, 8, 6, 9, 8, 8, 7, 7, 9, 10, 6, 7, 8, 2, 1, 7, 6, 3, 3, 1, 8, 4, 10, 7, 1, 10, 6, 9, 8, 2, 4, 6, 1, 8, 2, 6, 10, 2, 6, 2};

int origination[70] = {2, 7, 5, 5, 7, 2, 7, 2, 7, 7, 5, 2, 5, 5, 5, 2, 2, 7, 2, 7, 7, 2, 2, 2, 2, 5, 7, 5, 7, 7, 5, 5, 2, 2, 5, 7, 2, 5, 7, 2, 5, 7, 2, 5, 7, 2, 2, 7, 2, 7, 5, 2, 2, 2, 5, 7, 2, 5, 5, 5, 7, 7, 2, 5, 2, 7, 5, 2, 5, 7};

int destination[70] = {8, 7, 3, 10, 2, 6, 4, 5, 1, 3, 5, 9, 5, 8, 6, 4, 3, 7, 1, 2, 7, 2, 8, 2, 2, 1, 2, 6, 10, 2, 7, 7, 8, 6, 8, 8, 4, 8, 3, 10, 6, 9, 4, 9, 5, 1, 7, 3, 1, 7, 5, 5, 4, 9, 3, 10, 8, 1, 1, 1, 1, 8, 10, 3, 5, 2, 8, 7, 4, 10};

float price[6]={0,11.95,7.95,19.95,24.95,15.25};

func1(product);

func2(product,quantity,price);

func3(product,quantity,destination,price);

func4(product,quantity,price);

func5(product,quantity,origination,price);

func6(product,quantity,origination,price);

func7(origination,destination);

func8(product,quantity,origination,destination,price);

func9(destination);

func10(product,quantity,destination,price);

}

Explanation:

The program inputs order, products and cities products are shipped.

After a series of conditional requirements being met, will output the destination each product os going to and the number of products with its associated price.

Mathematics
Step-by-step answer
P Answered by Master

I DID YELLOWSTONE

Step-by-step explanation:

Make sense of the problem:

what is the estimated population for each animal at year 12.

Population 1 grizzly bear

1.  Is population 1 increasing or decreasing? (0.5 point)

Increasing

2. What is the rate of change between year 0 and year 1 for population 1? What is it between year 5 and year 10? Include calculations in your answer. (2 points)

The rate of change between year 0 and year 1 is .5 and the rate of change between year 5 and 10 is also .5

3. Predict the average rate of change from year 5 to year 6 for population 1. Use the average rate of change you found in question 2 in your prediction. (1 point)

I think the average rate of change from year 5 to year 6 is .5 this is because each year the population is increasing by .5 according to question 2.

4. What type of function best models the growth for population 1? Give a reason for your answer. (1 point)

A linear function would model population 1 the best. This is because the population is increasing by .5 each year. It increases as a steady rate so it will be a straight line.

Population 2 pocket gophers

5. What is the maximum population per square mile during the first 10 years for population 2? (0.5 point)

The maximum population per square mile during the first 10 years is 60.7.

6. What is the average rate of change for population 2 between years 5 and 10 (x = 5 to x = 10)? (1 point)

The average rate of change is 10.02

7. The average rate of change for population 2 changes by a common ratio (multiplication) of 1.5 each year. What type of function best models this growth? (1 point)

A exponential function would best model this growth.

8. Estimate the average rate of change from year 5 to year 6 for population 2. Remember, the average rate of change for this population changes by a ratio of 1.5 each year. Show your work. HINT: First find the average rate of change from year 4 to year 5. (3 points)

The rate of change from year 5 to year 6 is about 3.75 since population 2 changes by a ratio of 1.5 each year. The rate of change from year 4 to 5 is 2.5 so 2.5*1.5 is 3.75.

Population 3 Osprey

9. What is the maximum population per square mile during the first 10 years for population 3? In what year did this occur? (1 point)

The maximum population per square mile during the first 10 years is 9.0 this occured in year 5.

10. What is the average rate of change for population 3 between years 5 and 10 (x = 5 to x = 10)? Show your work. Identify the change as an increase or a decrease. (2 points)

The change is a decrease.

11. What type of function best models the growth for population 3? Give a reason for your answer. (1 point)

A quadratic function best models the growth for population 3 because at first the population increases but then it decreases.

12. Use the graph provided. When do all three populations contain the same number of animals? (1 point)

In year 0 all three populations contained the same amount of animals.

13. Use the following graphs to verify your work on this question.

A. Estimate the average rate of change from year 5 to year 8 for population 3. Show your work. (2 points)

7.2-9/8-5 = -1.8/3 = -0.6

B. Estimate the average rate of change from year 8 to year 10 for population 3. Show your work. (2 points)

4-7.2/10-8 = -3.2/2 = -1.6

C. Based on the answers to Parts A and B, estimate the number of animals in population 3 in year 15, and give a reason for your estimate. (1 point)

The number of animals in year 15 will be 0 this is because the number of animals keeps steadily going down and you cannot have a negative number of animals.

Try asking the Studen AI a question.

It will provide an instant answer!

FREE