We need to conduct a hypothesis in order to test the claim that the true proportion is equal to 14.6% or not. So we need to use a one proportion z test and the system of hypothesis are:
Null hypothesis:
Alternative hypothesis:
A. One-proportion z-test
When we conduct a proportion test we need to use the z statisitc, and the is given by:
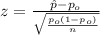 (1)
(1)
And the conditions required are:
1) The data comes from a random sampling
2) Independence condition between observations
3) np>10 and n(1-p)>10
4) The sample size is 10 times lower than the population size.
Step-by-step explanation:
Data given and notation
n=865 represent the random sample taken
X=159 represent the housing units that are vacant
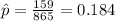 estimated proportion of vacant units
 is the value that we want to test
 represent the significance level
z would represent the statistic (variable of interest)
 represent the p value (variable of interest)
Solution to the problem
We need to conduct a hypothesis in order to test the claim that the true proportion is equal to 14.6% or not. So we need to use a one proportion z test and the system of hypothesis are:
Null hypothesis:
Alternative hypothesis:
A. One-proportion z-test
When we conduct a proportion test we need to use the z statisitc, and the is given by:
(1)
And the conditions required are:
1) The data comes from a random sampling
2) Independence condition between observations
3) np>10 and n(1-p)>10
4) The sample size is 10 times lower than the population size.
 3
3