Step-by-step explanation:
Hello!
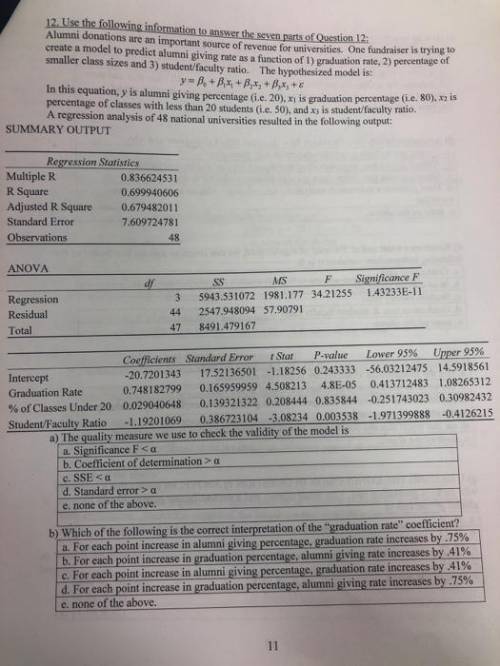
Given the variables
Y: Alumni donations
X₁: Graduation rate
X₂: percentage of classes with less than 20 students
X₃: student/faculty ratio
The multiple regression model is:
Y= β₀ + β₁X₁ + β₂X₂ + β₃X₃ + ε
1)
The correct option is
e. none of the above.
The measurement used to determine the validity of the test is the coefficient of determination R².
2)
The general interpretation of a regression coefficient βi is:
"quantifies the modification of the mean of Y when the response variable Xi increases one unit while all the other response variables remain constant"
^β₁= b₁= 0.748% represents the "graduation rate coefficient"
It is the modification of the average alumni donations when the graduation rate increases one unit while the percentage of classes with less than 20 students and the student/faculty ratio remain constant.
Correct option: d. For each point increase in graduation percentage, alumni giving rate increases by .75%
3)
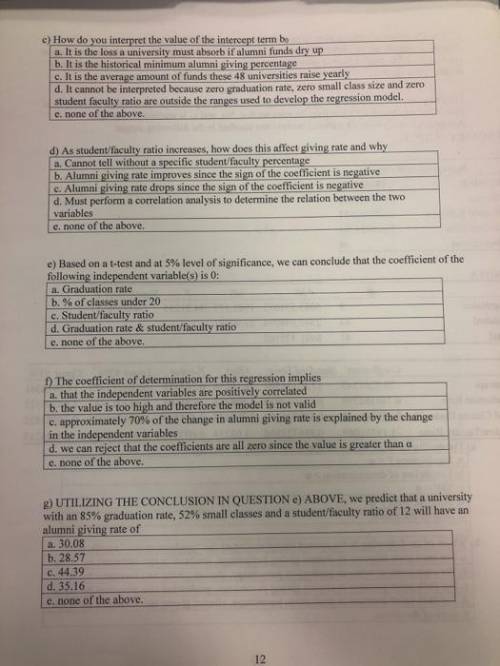
The intercept (b₀) is the value of the average of Y when all response variables are zero.
b₀= -20.72%
Using a general interpretation: -20.72% is the average alumni donation when the graduation rate, percentage of classes with less than 20 students and student/faculty ratio are zero.
Of course this interpretation is theoretical, meaning, it does not have any practical application.
The correct option is:
e. none of the above.
4)
To determine how does and increase of the student/faculty ratio you have to take a look at the estimation of the regression coefficient that corresponds to that variable:
b₃= -1.1920
This ratio means that every time the student/faculty ratio increases one unit, the giving rate decreases 1.192%
Correct option:
c. Alumni giving rate drops since the sign of the coefficient is negative
5)
I'll use the given p-values to check the significance of each individual hypothesis test. The decision rule for all of them is as follows:
If p-value ≤ α, reject the null hypothesis.
If p-value > α, don't reject the null hypothesis.
I)
H₀: β₁ = 0
H₁: β₁ ≠ 0
α: 0.05
p-value: 4.8E-5 ⇒ Reject the null hypothesis.
II)
H₀: β₂ = 0
H₁: β₂ ≠ 0
α: 0.05
p-value: 0.835844 ⇒ Do not reject the null hypothesis.
III)
H₀: β₃ = 0
H₁: β₃ ≠ 0
α: 0.05
p-value: 0.003538 ⇒ Reject the null hypothesis.
Correct option:
d. Graduation rate & student/faculty ratio
6)
R²= 0.6999⇒ 69.99%
Correct interpretation:
c. approximately 70% of the change in alumni giving rate is explained by the change in the independent variables
7)
^Y= -20.72 + 0.748X₁ + 0.029X₂ - 1.192X₃
For X₁= 85, X₂= 52 and X₃= 12
^Y= -20.72 + 0.748*85 + 0.029*52 - 1.192*12= 30.064
Correct option
a. 30.08
I hope it helps!

