Explained below.
Step-by-step explanation:
The question is:
Compare the distributions using either the means and standard deviations or the five-number summaries. Justify your choice.
Set A: {36, 51, 37, 42, 54, 39, 53, 42, 46, 38, 50, 47}
Set B: {22, 57, 46, 24, 31, 41, 64, 50, 28, 59, 65, 38}
The five-number summary is:
MinimumFirst Quartile Median Third Quartile Maximum
The five-number summary for set A is:
Variable Minimum Q₁ Median Q₃ Maximum
Set A 36.00 38.25 44.00 50.75 54.00
The five-number summary for set B is:
Variable Minimum Q₁ Median Q₃ Maximum
Set B 22.00 28.75 48.00 58.50 65.00
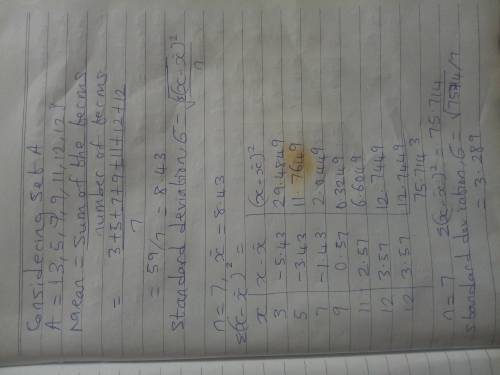
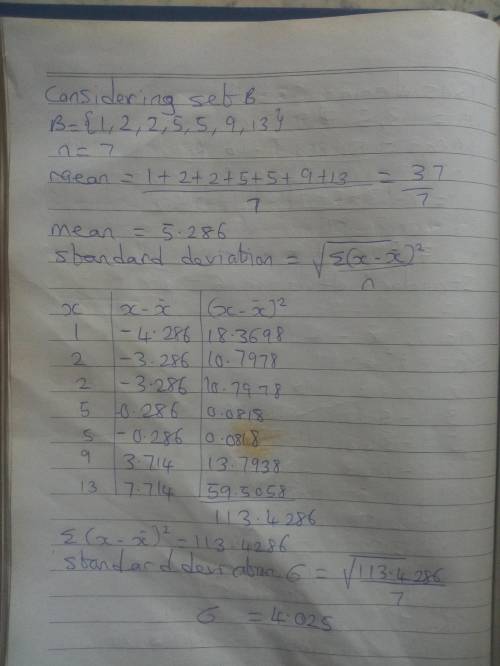
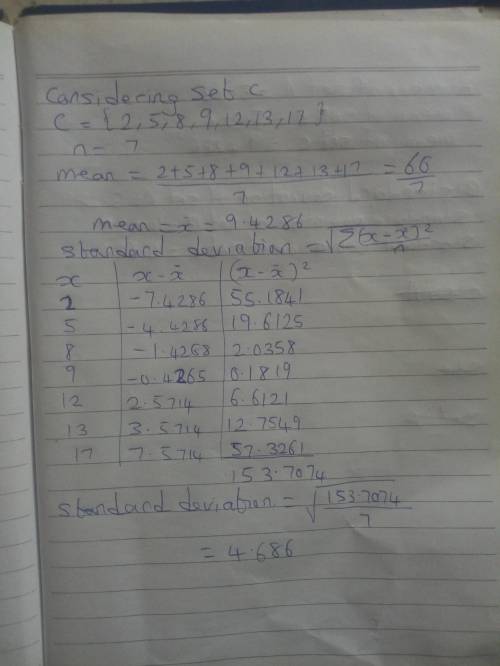
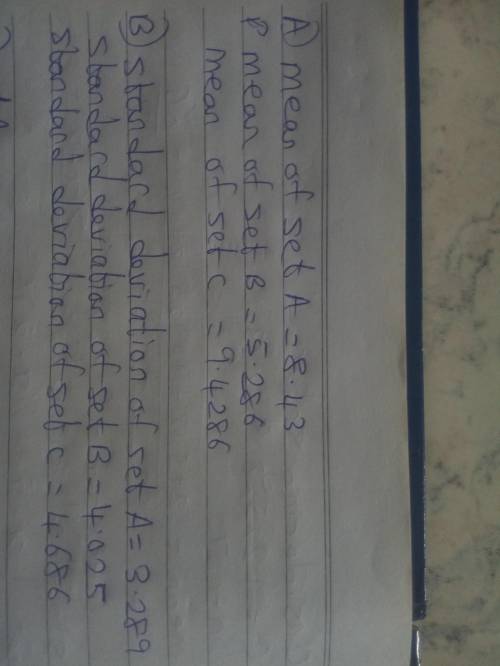
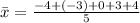
Compute the mean for both the data as follows:
![Mean_{A}=\frac{1}{12}\times [36+51+37+...+47]=44.58\approx 44.6\\\\Mean_{B}=\frac{1}{12}\times [22+57+46+...+38]=44.58\approx 44.6](/tpl/images/0703/5372/ba6cb.png)
Both the distribution has the same mean.
Compare mean and median for the two data:
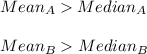
This implies that set A is positively skewed whereas set B is negatively skewed.
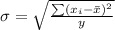
Compute the standard deviation for both the set as follows:
![SD_{A}=\sqrt{\frac{1}{12-1}\times [(36-44.6)^{2}+...+(47-44.6)^{2}]}=6.44\approx 6.4\\\\SD_{B}=\sqrt{\frac{1}{12-1}\times [(22-44.6)^{2}+...+(38-44.6)^{2}]}=15.56\approx 15.6](/tpl/images/0703/5372/6d95f.png)
The set B has a greater standard deviation that set A. Implying set B has a greater variability that set B.
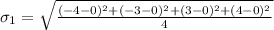
 9
9![\bar x=\frac{1}{n}\sum x=\frac{1}{5}\times [124+94+...+114]=114\\\\s=\sqrt{\frac{1}{n-1}\sum ( x-\bar x)^{2}}](/tpl/images/0723/8351/af3ec.png)
![=\sqrt{\frac{1}{5-1}\times [(124-114)^{2}+(94-114)^{2}+...+(114-114)^{2}]}\\=\sqrt{\frac{750}{4}}\\=13.6931\\\approx 13.69](/tpl/images/0723/8351/2e055.png)


 the above statement is false

