Option B is the correct answer.
Step-by-step explanation:
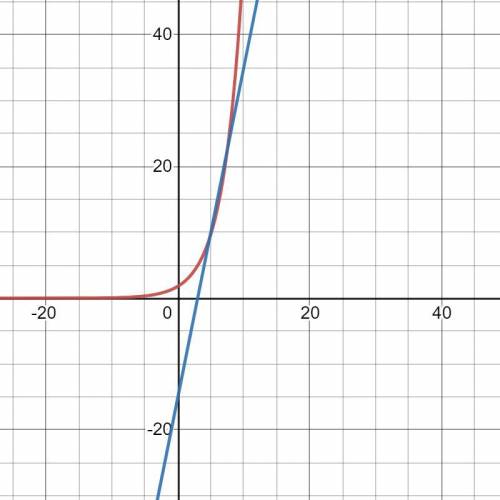
Two companies modeled their profits for one year.
(1) Company A used the function P (t) =  to represent its monthly profit in hundreds of dollars after time t.
(2) Company B used the data of the table to write a linear model to represent its monthly income.
Let the linear function is P (t) = mt + c
where m is the slope of the line and c is y - intercept.
As per data we find two points (3.5) and (4.10) lying on the line.
so slope of the line = 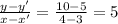
and point (3.5) passes through the given line
so, 5 = 5 × 3 + c
5 = 15 + c
c = 5 - 15 = - 10
So function will be P (t) = 5t-10
Now at t = 4
Company (A) profit P(4) =  = 6.91
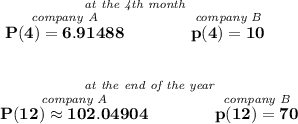
Company (B) profit p (4) = 5 × 4 - 10 = 10
so at t = 4 profits of Company B are more than Company A.
At t = 12
Company A profit P (12) =  = 102.05
Company B profit P (12) = ( 5×12 ) - 10 = 66 - 10 = 50
So profit of company A is more at the end of the year.
Option B is the answer.