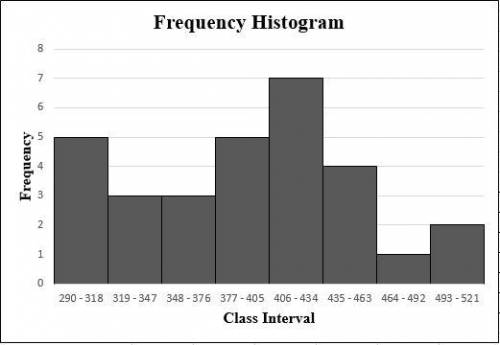
The histogram for the data is attached below.
Step-by-step explanation:
Arrange the data in ascending order as follows:
S = {291
, 301
, 306
, 307
, 310
, 321
, 326
, 336
, 352
, 357
, 373
, 380
, 385
, 386
, 386
, 386
, 412
, 413
, 418
, 424
, 429
, 429
, 430
, 442
, 443
, 450
, 454
, 467
, 508
, 514}
Compute the range:
Compute the class width:

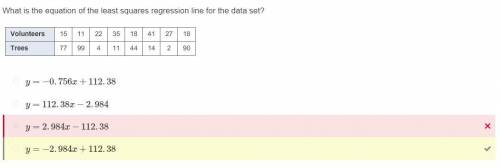
The classes are as follows:
290 - 318
319 - 347
348 - 376
377 - 405
406 - 434
435 - 463
464 - 492
493 - 521
Compute the frequency distribution as follows:
Class Interval Frequency
290 - 318 5
319 - 347 3
348 - 376 3
377 - 405 5
406 - 434 7
435 - 463 4
464 - 492 1
493 - 521 2
The histogram for the data is attached below.
 7
7