1. B) 32 m/s
The speed of the baseball is given by

where
d = 48 m is the distance travelled
t = 1.5 s is the time taken
Substituting,

2. C) 12 m/s
The average velocity is given by

where
d = 60 - 0 = 60 m is the displacement
t = 5 s is the time interval
Substituting,

3. Missing diagram
4. D) velocity
In fact, velocity is defined as the ratio between the displacement ( ) and the time interval (
 ) needed to achieve that change in position:

Similarly, acceleration is defined as the ratio between the change in velocity ( ) and the time interval (
 ):
):

Comparing the two equations, we see that displacement is to velocity as velocity is to acceleration.
5. C) 5/1 cm/year
We know that the ridge moves 25 cm in 5 years, so we have:
- Displacement (d): d = 25 cm
- Time interval (t): t = 5 y
Using the equation for the velocity:

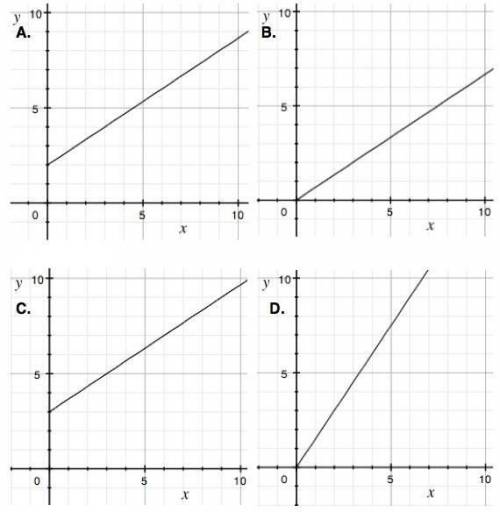
6. D
The missing graph is attached. Each graph represents a distance (on the y-axis, measured in metres) versus a time (on the x-axis, measured in seconds). Therefore, the speed in each graph can be simply calculated from the slope of the curve, since speed is the ratio between distance and time:

For each graph:
A. 
B. 
C. 
D. 
So we can say that the correct graph must be graph D, the closest to 1.57.
7. B) The car has come to a stop and has zero velocity
The missing graph is attached.
The graph shows the position of the car versus time. From the graph, we can see that in segment B, the position of the car does not change: this means that its velocity is zero, since the velocity is defined as the ratio between the change in position (displacement) and the time interval:

And since the displacement is zero, the velocity is also zero.
8. C) from 4.5 to 5.0 seconds
Missing graph is attached.
The graph represents the distance covered versus the time taken: therefore, the speed of the ball can be evaluated from the slope of the curve.
The only region in which the slope of the curve is zero is between 4.5 seconds and 5.0 seconds: therefore, this is the region where the soccer ball is not moving.
9. D) diagonal line with varying slope, from 3 to 4.
The table of data is:
Time (s) 0 1 2 3 4
Distance (m) 0 3 6 12 16
We want to know how the distance/time graph would like like. We have:
- At t = 1, the distance is  , so the slope is
- Similarly, at t = 2: 
- Instead, at t =3, the slope is 
- Similarly, at t=4,
So the correct answer is D.
10. D) To move in a circle requires an acceleration and therefore a net force. This force is supplied by the slingshot.
For an object in circular motion, the velocity constantly changes (because the direction changes): this means that an acceleration is required (towards the centre of the circle), and therefore a force must be exerted (also towards the centre of the circle) to keep the object in the circular path.
As soon as this force is removed, the object is "free" to leave the circular trajectory and continue its motion following a straight path at constant velocity, according to Newton's first law.
11. B) The acceleration will become 1/4 as much.
Re-arranging Newton's second law formula,
 (1)
(1)
The force exerted on the satellite is actually the force of gravity:
 (2)
(2)
Substituting (2) into (1),

We see that there is no dependance on the mass of the satellite (m), but only on the distance. Since in this problem the distance is doubled (d'=2d), the new acceleration will be:

12. C) divide: distance : velocity
Velocity is distance divided by time:

Multiplying by t on both sides,

and dividing by v on both sides,

13. A) -8 km/h
Let's call:
 the velocity of the kite
 your velocity (opposite direction)
In your frame of reference, the velocity of the kite will be:

