Step-by-step explanation:
a)
Here researcher claims that the mean weight loss for those on low-carbohydrate or Mediterranean diets is greater than the mean weight loss for those on a conventional low-fat diet
Set the null and alternative hypotheses to test the above claim as below.
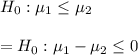 versus
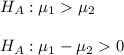
b)
Assume that the variance of the two populations are equal.
Under the null hypothesis, the test statistics is defined as
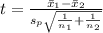
where 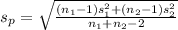
Use the foll owing Excel instructions and conduct the above test.
Step1: Enter the datainto two columns of spreadsheet.
Step2: Select Data Analysis from Data ribbon.
Step3: Select t-test. Two-sample Assuming equal variances.
Step4: Input the data range for variable 1 and variable 2.
Step5: Enter 0 as the Hypothesized Mean Difference.
Step6: Click OK.
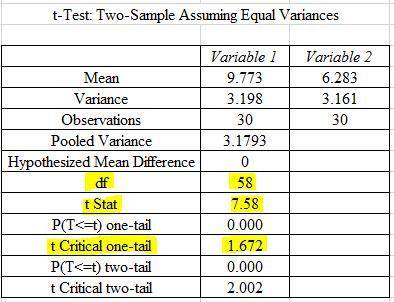
Thus, the resultant outout is as follows:
Low-carb Low-fat
Mean 9.773333333 6.283333333
Variance 3.197885057 3.160747126
Observations 30 30
Pooled Variance 3.179316092
Hypothesized Mean Difference 0
df 58
t Stat 7.580610844
P(T < = t) one-tail 1.54916E - 10
t Critical one — tail 1.671552762
P(T <2) two-tail 3.09831E - 10
t Critical two - tail 2.001717484
1) From the above output, the test statistics is obtained as t = 7.5806
2) From the above output, the critical value for one-tailed testis obtained as 
Rejection rule: Reject  if
if 
c)
At 5% level of significance, the calculated value of test statistics is greater than the critical value.
Therefore, reject the null hypothesis.
Hence, the nutritionist conclude that overweight people on low-carbohydrate or Mediterranean diets lost more weight than people on a conventional low-fat diet.
 18
18