 2
2 Answer Part A:
1. There is a significant negative relationship between anxiety and academic performance, described as:
a. Subjects with lower anxiety scores have higher current GPAs, or;
b. Subjects who have lower current GPAs have higher anxiety scores.
Explanation:
We can tell that the two variables (anxiety and academic performance) have a negative relationship from its correlation coefficient (-.64). The negative sign shows the relationship, while the statistical significance (p < .01 or p < .05) shows whether there is a relationship or not.
Remember, the power of the correlation (as represented by the number 0.64) does not tell you whether a relationship actually happens or not. It can, however tell the strength of a relationship. A .64 is usually described as moderate to strong, depending on which reference you are using.
Also remember that this is not causation - we do not know which variable causes changes at the other. This is why it is possible to describe the relationship with either option (A) or (B). It is preferable to use a neutral sounding one such as the one stated above: By only saying that there is a negative relationship between the two variables.
2. There is no relationship between hours sleeping per night and academic performance.
Explanation:
A correlation coefficient of 0.00 means that there is no relationship between two variables. The closer a correlation coefficient to 0, the less likely do the variables have a relationship with one another.
Answer Part B:
1. It contributes to the interpretation of the findings by discussing whether:
(1) The measurement used is appropriate for the research conducted,
(2) There are any limitations from the current method of measurement.
Explanation:
The operational definitions in the study are not explicitly stated, but we can come to our own conclusions from the description of the study. They are:
Academic performance is the current GPA as reported by the research subjects.
Anxiety is the anxiety score summed from the research subjects' responses to the anxiety scale.
Interpretation is usually done during the discussion part of a research journal, after the statistical results have been reported. Discussing operational definitions would help determine whether the right measurement is used. Is the method free of biases? For example, Dr. Aguilera used a 5-point scale to measure the student's anxiety levels; there is a possibility of central tendency bias occurring.
2. Cohort effects may contribute to a possible bias over the result of the research. The variations in both anxiety levels and GPA may not be due to each other's influences, but perhaps instead caused by other age-related experience variables such as social media use.
Explanation:
Cohort effects are defined as a condition shared with same-aged groups of people which affected the result of the research. It is a form of bias, when it is not controlled. Dr. Aguilera's study is at risk of being affected with this since her research subjects are all university students.
In the study, we saw that Dr. Aguilera measured social media use, however, she did not seem to control this variable. It is possible that the variation in anxiety is moderated by social media, which then affects the subjects' GPA.
 2
2  4
4 Something that is persistent remains over time; this is a key characteristic of DDT, which also happens to be a pollutant/pesticide. DDT is able to persist in an environment (as a pollutant) in part due to a phenomenon known as biological magnification. In simpler terms. once DDT enters an ecosystem/trophic structure, it gets worse as you go up the trophic levels; in other words, this means that the worst effects/concentrations of the pesticide will be felt in the uppermost trophic levels (your consumers rather than producers).
The basis for this, however, lies in the fact that organisms of a trophic structure/ecosystem consume each other; they feed on each other to survive (e.g. consumers feeding on producers, higher-level consumers feeding on lower-level consumers, etc.). Thus, once DDT gets into an ecosystem, it can only persist and spread in that ecosystem. Hope this helps :)
 8
8 The proportion of the available motorcycles that Molly can afford is 60%.
The 30th percentile for the motorcycle is $11920
It should be noted that $25,000 is considered an outlier because it is greater than $24792
Since, mean, μ = $14,000 and standard deviation, σ = $4,000, the standard variable Z or x = $15,000 will be:
Z = (x - μ)/σ
Z = (15000 - 14000)/4000
Z = 0.25
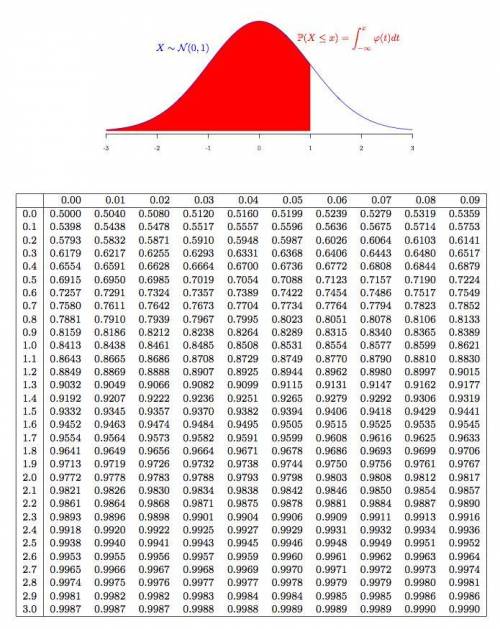
We then check the table and see that it implies that Molly can buy 60% of the available motorcycles.
The 30th percentile for the prices of motorcycles of this type corresponds to a value of Z = -0.52. This will then be:
x = μ + Z*σ
x = 14000 + (-0.52) × 4000
x = $11920
Lastly, the third quartile value when added to 1.5 x IQR will be equal to:
= 16698 + (1.5 × 5396) = $24792
Therefore, $25,000 is considered an outlier because it is greater than $24792
Read related link on:
link


 12
12 Yes, the business journal is interpreting the probability correctly, because 3 out of 5 randomly selected Internet users that will use the mobile payment application, means that, 3/5, or 0.6 of probability. That is exactly the probability reported by the business journal.
Explanation:
Probability that Internet users in the United States will use a mobile payment app is 0.60.
 4
4 The algorithm's runtime has been divided into two main categories are given below.
Explanation:
Polynomial runtime would be defined as almost any run time that doesn't even improve quicker than , including fixed time (
 ), logarithmic time (log2{n}), linear (
 ), quadratic (
 ), as well as another polynomial of higher degrees (such as
  ). The runtime that grows more than
  and contains exponential time including such (
 ), factorial time (n!), or anything else is super polynomial runtime.It seems it is perceived that polynomial runtime seems to be rational as well as super polynomial growth in order are rendered irrational. It is not necessarily ideal to have a polynomial run time, but it's least theoretically possible.
 Then maybe we can easily see by the information collected that perhaps the algorithm is increasing at either the frequency of 20×n. At which, across every iteration, n seems to be the input dimension. This suggests that perhaps the runtime specified seems to be of a polynomial category, therefore means that even this technique executes within a rational period.
 83
83 To generate objective knowledge about any area it is important to use the scientific method. The scientific method uses measurement, analysis, observation, and experimentation to obtain objective data to validate the hypotheses and generate knowledge.
In this case, City University carried out a scientific investigation to verify that its students were happy throughout the time in the university. For the investigation, they used an instrument that evaluates satisfaction. The results indicate that the senior-students are happier than the first-year students, for that the university officials conclude that the students are happier when they attend university for a longer time. This is convenient to attract new students and not change to another study center.
I hope this information can help you.
 5
5 B
Explanation:
 2
2 
 21
21 There is a probability of 89.44% that more than 3.75 gallons are used for any wash cycle.
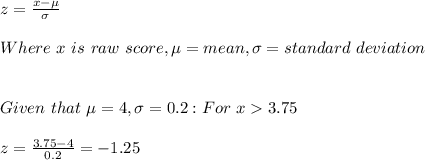
The z score is used to determine by how many standard deviations the raw score is above or below the mean. The z score is given by:

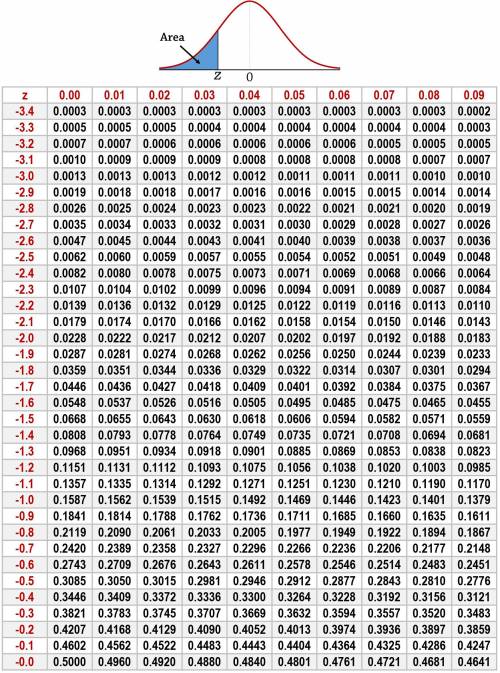
From the normal distribution table, P(x > 3.75 ) = P(z > -1.25) = 1 - P(z < 1.25) = 1 - 0.1056 =89.44%
Find out more at: link

It will provide an instant answer!
