A) Most points are between these limits, so the process appears to be in control with respect to variability.
D) The value of S on the 5th day lies above the UCL, so an out-of-control signal is generated.
Step-by-step explanation:
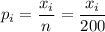
We have the data of 30 days of daily samples, of size n=200. The data is expressed in "number of non-conforming chips". To graph the data in a p-chart, we have to calculate the proportion, so we have to divide the number of non-conforming chips in each sample by the sample size in order to get the proportion.
The data of non-conforming chips es:
[916241836196268253017161915201322]
The proportion of non-conforming chips is calculated as:
Then, the proportions of non-conforming chips are:
[0.0450.080.120.090.180.0950.030.130.040.1250.150.0850.080.0950.0750.10.0650.110.0450.1150.090.0750.0750.1250.160.0950.060.1150.0750.13
]
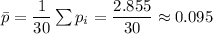
For the p-chart we calculate the average proportion:
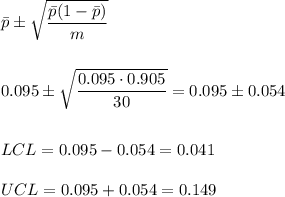
Then, we calculate the control limits as:
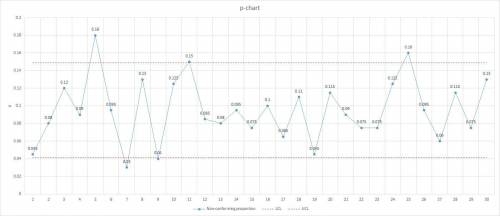
With these values, we can graph the data in the p-chart.
We can see that most points are within these limits, as it is expected (we are calculating the control limits with the same data we are charting). There are 5 out of 30 (one sixth of the samples) that are outside the control limits but there are not more than one consecutive points outside the contorl limits, so we can conclude that the process is in control.
The value of the 5th day (p=0.180) is over the UCL (UCL=0.149), so an out-of-control signal is generated. As the 6th day sample is in control (p=0.095), we could conclude that a special condition makes the 5th day sample lies outside the control limits.
 1
1