I DID YELLOWSTONE
Step-by-step explanation:
Make sense of the problem:
what is the estimated population for each animal at year 12.
Population 1 grizzly bear
1. Is population 1 increasing or decreasing? (0.5 point)
Increasing
2. What is the rate of change between year 0 and year 1 for population 1? What is it between year 5 and year 10? Include calculations in your answer. (2 points)
The rate of change between year 0 and year 1 is .5 and the rate of change between year 5 and 10 is also .5
3. Predict the average rate of change from year 5 to year 6 for population 1. Use the average rate of change you found in question 2 in your prediction. (1 point)
I think the average rate of change from year 5 to year 6 is .5 this is because each year the population is increasing by .5 according to question 2.
4. What type of function best models the growth for population 1? Give a reason for your answer. (1 point)
A linear function would model population 1 the best. This is because the population is increasing by .5 each year. It increases as a steady rate so it will be a straight line.
Population 2 pocket gophers
5. What is the maximum population per square mile during the first 10 years for population 2? (0.5 point)
The maximum population per square mile during the first 10 years is 60.7.
6. What is the average rate of change for population 2 between years 5 and 10 (x = 5 to x = 10)? (1 point)
The average rate of change is 10.02
7. The average rate of change for population 2 changes by a common ratio (multiplication) of 1.5 each year. What type of function best models this growth? (1 point)
A exponential function would best model this growth.
8. Estimate the average rate of change from year 5 to year 6 for population 2. Remember, the average rate of change for this population changes by a ratio of 1.5 each year. Show your work. HINT: First find the average rate of change from year 4 to year 5. (3 points)
The rate of change from year 5 to year 6 is about 3.75 since population 2 changes by a ratio of 1.5 each year. The rate of change from year 4 to 5 is 2.5 so 2.5*1.5 is 3.75.
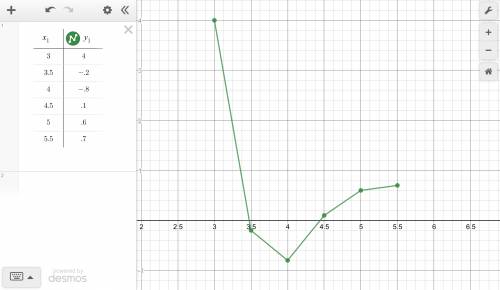
Population 3 Osprey
9. What is the maximum population per square mile during the first 10 years for population 3? In what year did this occur? (1 point)
The maximum population per square mile during the first 10 years is 9.0 this occured in year 5.
10. What is the average rate of change for population 3 between years 5 and 10 (x = 5 to x = 10)? Show your work. Identify the change as an increase or a decrease. (2 points)
The change is a decrease.
11. What type of function best models the growth for population 3? Give a reason for your answer. (1 point)
A quadratic function best models the growth for population 3 because at first the population increases but then it decreases.
12. Use the graph provided. When do all three populations contain the same number of animals? (1 point)
In year 0 all three populations contained the same amount of animals.
13. Use the following graphs to verify your work on this question.
A. Estimate the average rate of change from year 5 to year 8 for population 3. Show your work. (2 points)
7.2-9/8-5 = -1.8/3 = -0.6
B. Estimate the average rate of change from year 8 to year 10 for population 3. Show your work. (2 points)
4-7.2/10-8 = -3.2/2 = -1.6
C. Based on the answers to Parts A and B, estimate the number of animals in population 3 in year 15, and give a reason for your estimate. (1 point)
The number of animals in year 15 will be 0 this is because the number of animals keeps steadily going down and you cannot have a negative number of animals.

 131
131